Session Count Trends
A Session Count Trends graph for a chatbot is a visual representation that tracks and displays changes in the number of sessions initiated by users over a period of time. This graph provides insights into how user interaction patterns evolve and whether there are trends in the frequency of user sessions with the chatbot.
Here's how to interpret and understand a Session Count Trends graph for a chatbot:
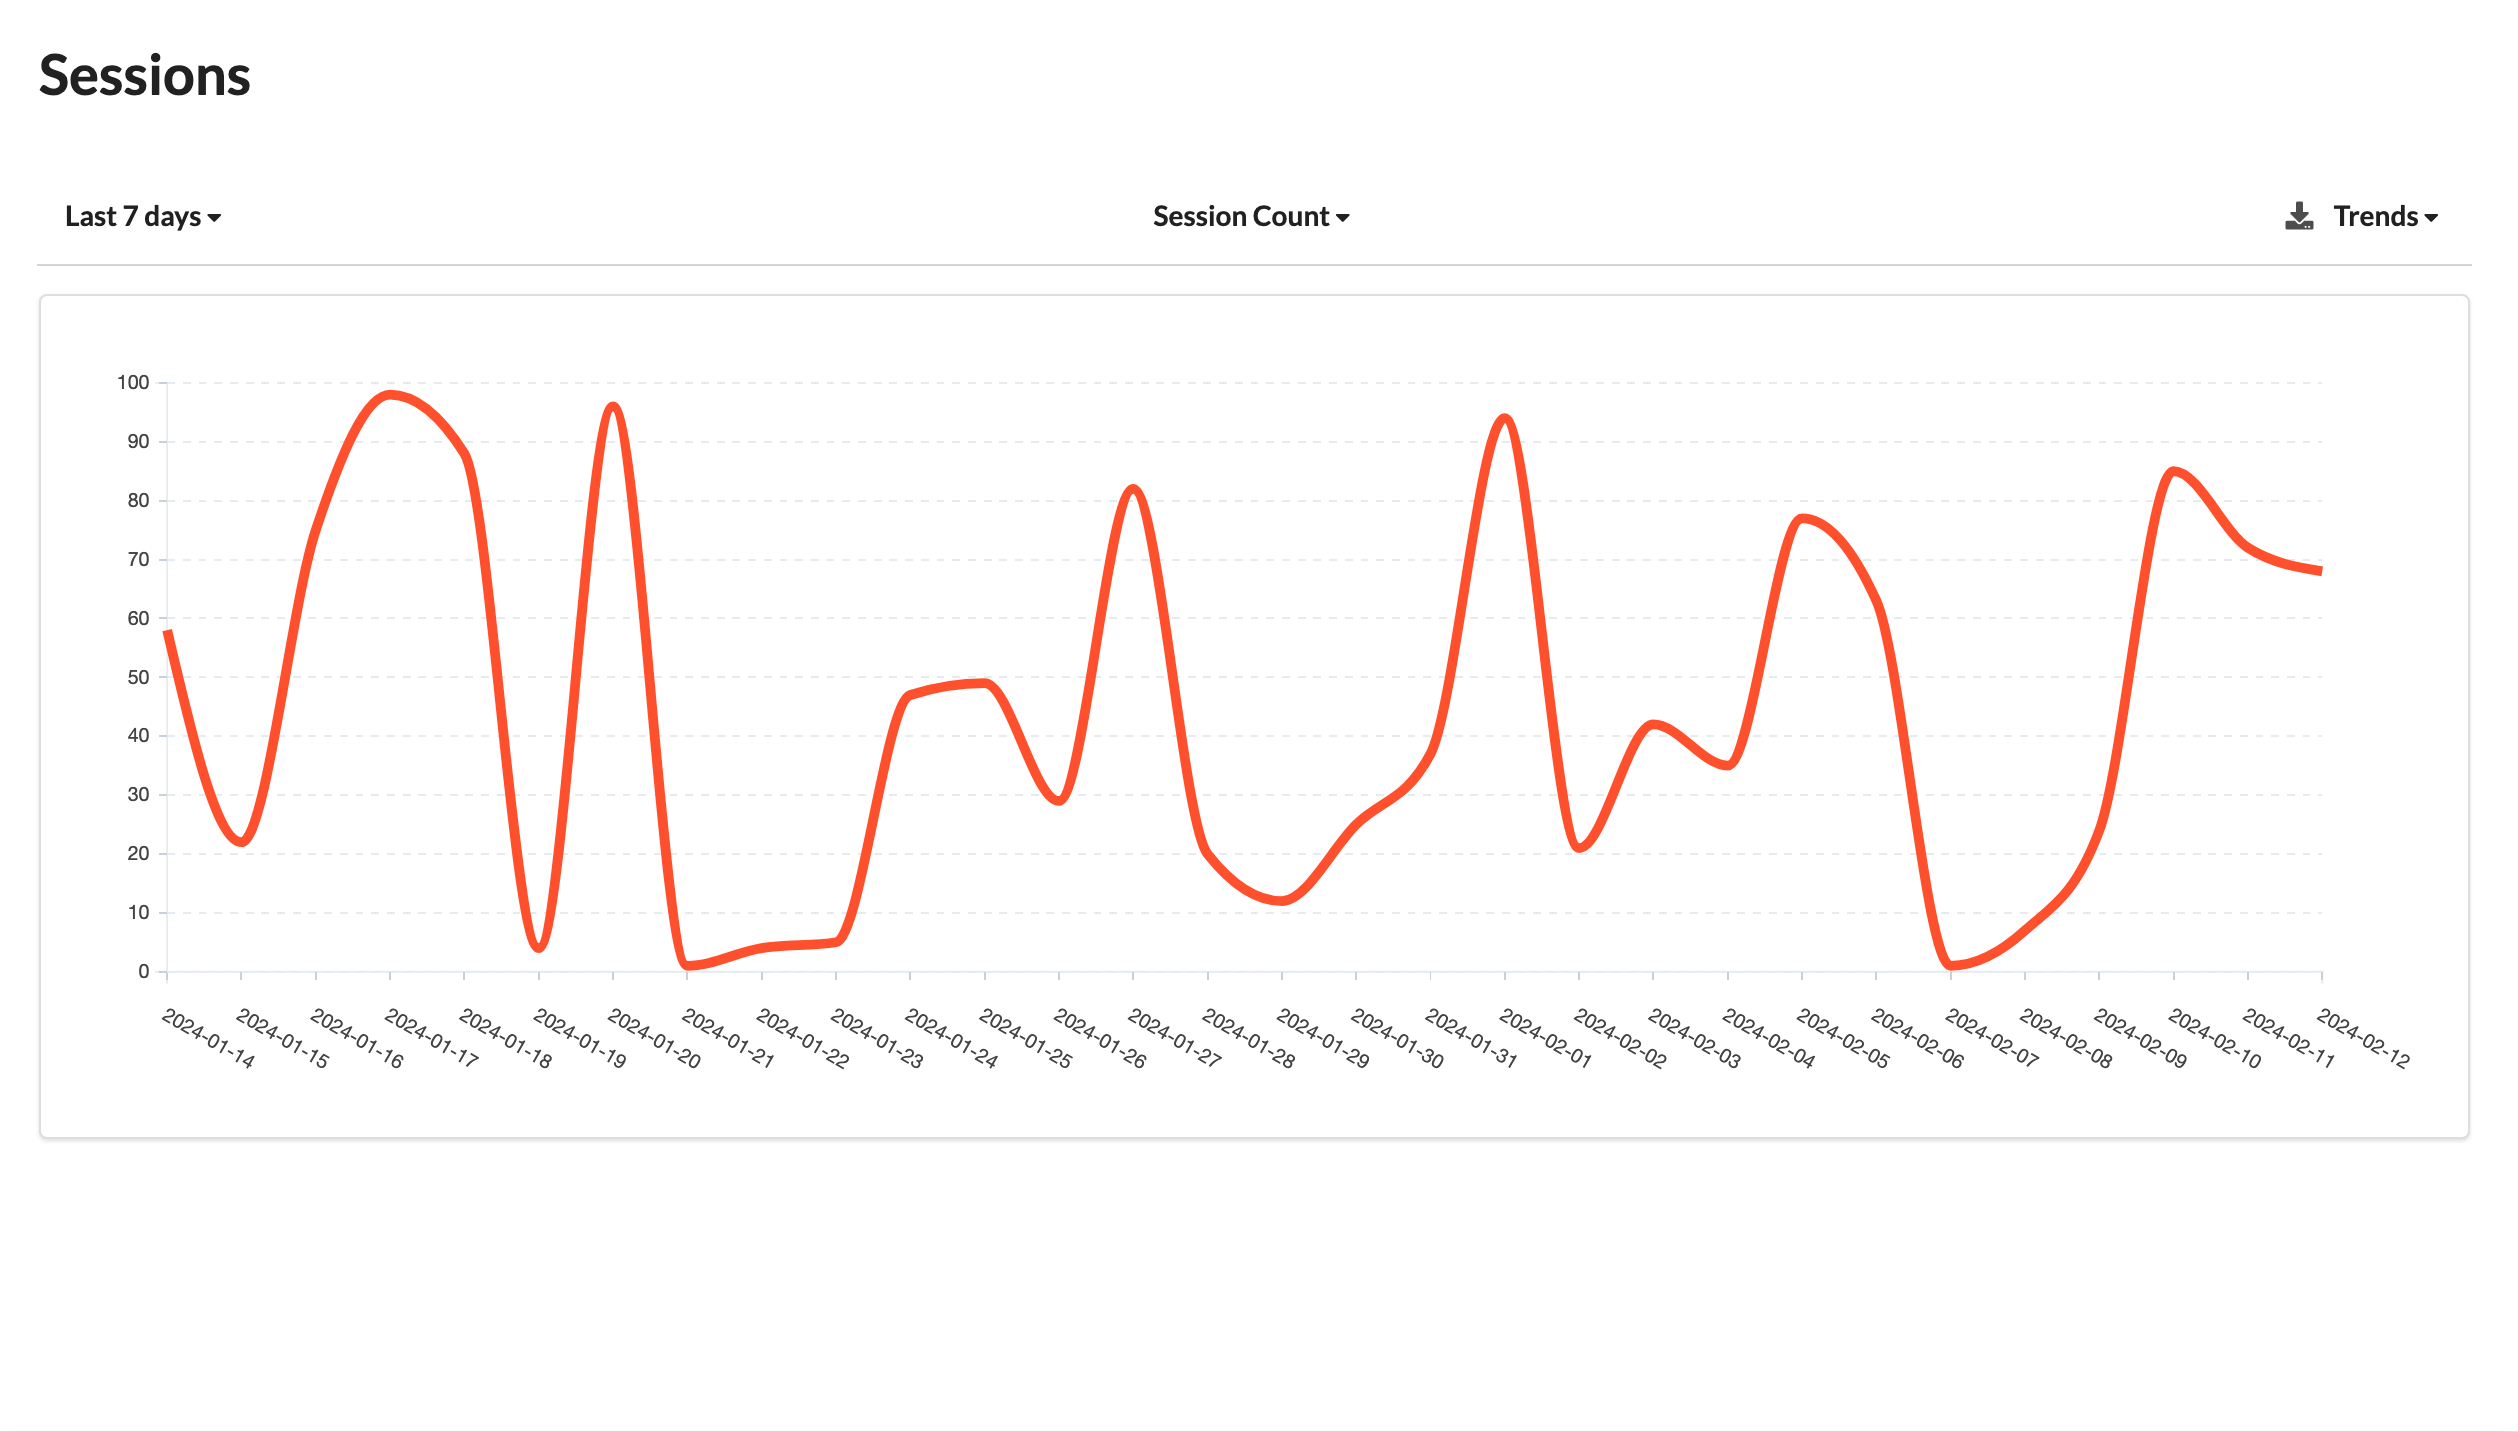
X-Axis (Time Period)
The x-axis of the graph represents a specific time period, such as days, weeks, or months, depending on the data's granularity. It shows when the user sessions occurred or were recorded.
Y-Axis (Number of Sessions)
The y-axis represents the number of user sessions that took place during the corresponding time period. It measures the total count of sessions for that time frame.
Data Points
Each data point on the graph represents the total count of user sessions that occurred during a particular time period. This data is typically collected and aggregated over time.
Trend Line
In a line graph, the trend line connects the data points, providing a visual representation of how the number of sessions changes over the specified time frame. An upward trend indicates increasing session activity, while a downward trend suggests decreasing activity.
Interpreting a Session Count Trends Graph for a Chatbot
Direction of Trend
The overall direction of the trend line is critical. An upward trend in session counts suggests that the chatbot is experiencing increased user engagement, while a downward trend may indicate declining user interaction.
Periodic Patterns
Seasonal or recurring patterns in session count trends can be observed. For example, if there are weekly or monthly spikes in session counts, it may be related to certain events or user behaviors.
Anomalies
Sudden spikes or drops in session counts can indicate unusual user behavior, chatbot performance issues, or specific events that require further investigation.
Correlation with Changes
It's important to correlate trends with specific changes in the chatbot, such as updates to content, features, or marketing efforts. A notable change in session count trends after an update can provide valuable insights.
User Engagement
Understanding session count trends helps gauge overall user engagement with the chatbot. An increase in session counts may indicate that users are finding more value in their interactions.
Optimization Opportunities
Analyzing trends over time can help chatbot developers identify areas for improvement, such as optimizing content, responses, or user guidance to attract and retain more users.
Use Cases for Session Count Trends Analysis
Performance Evaluation
Monitoring session count trends helps assess the effectiveness and performance of the chatbot in attracting and retaining user engagement.
Content Optimization
Trends analysis can guide content optimization efforts to ensure that the chatbot provides valuable information efficiently.
User Experience Enhancement
Insights from session count trends can lead to improvements in the chatbot's user experience, making it more engaging and user-friendly.
Marketing and Promotion
Marketers can use session count trends to measure the effectiveness of promotional campaigns and assess their impact on user engagement.
A/B Testing
When conducting A/B tests with different versions of the chatbot, session count trends can be used as a key metric to evaluate which version attracts more user interactions.
Summary
In summary, a Session Count Trends graph for a chatbot provides a visual representation of how user interaction patterns change over time. It offers valuable insights into user engagement and the chatbot's performance, guiding developers and operators in optimizing the chatbot's design and content to enhance the user experience.