Session Duration Distribution
A Session Duration Distribution graph for a chatbot visually represents the distribution of time durations that users spend interacting with the chatbot during their sessions. This graph offers insights into users' typical engagement durations, aiding chatbot developers and operators in understanding user behavior and session length patterns.
Here's how to interpret and understand a Session Duration Distribution graph:
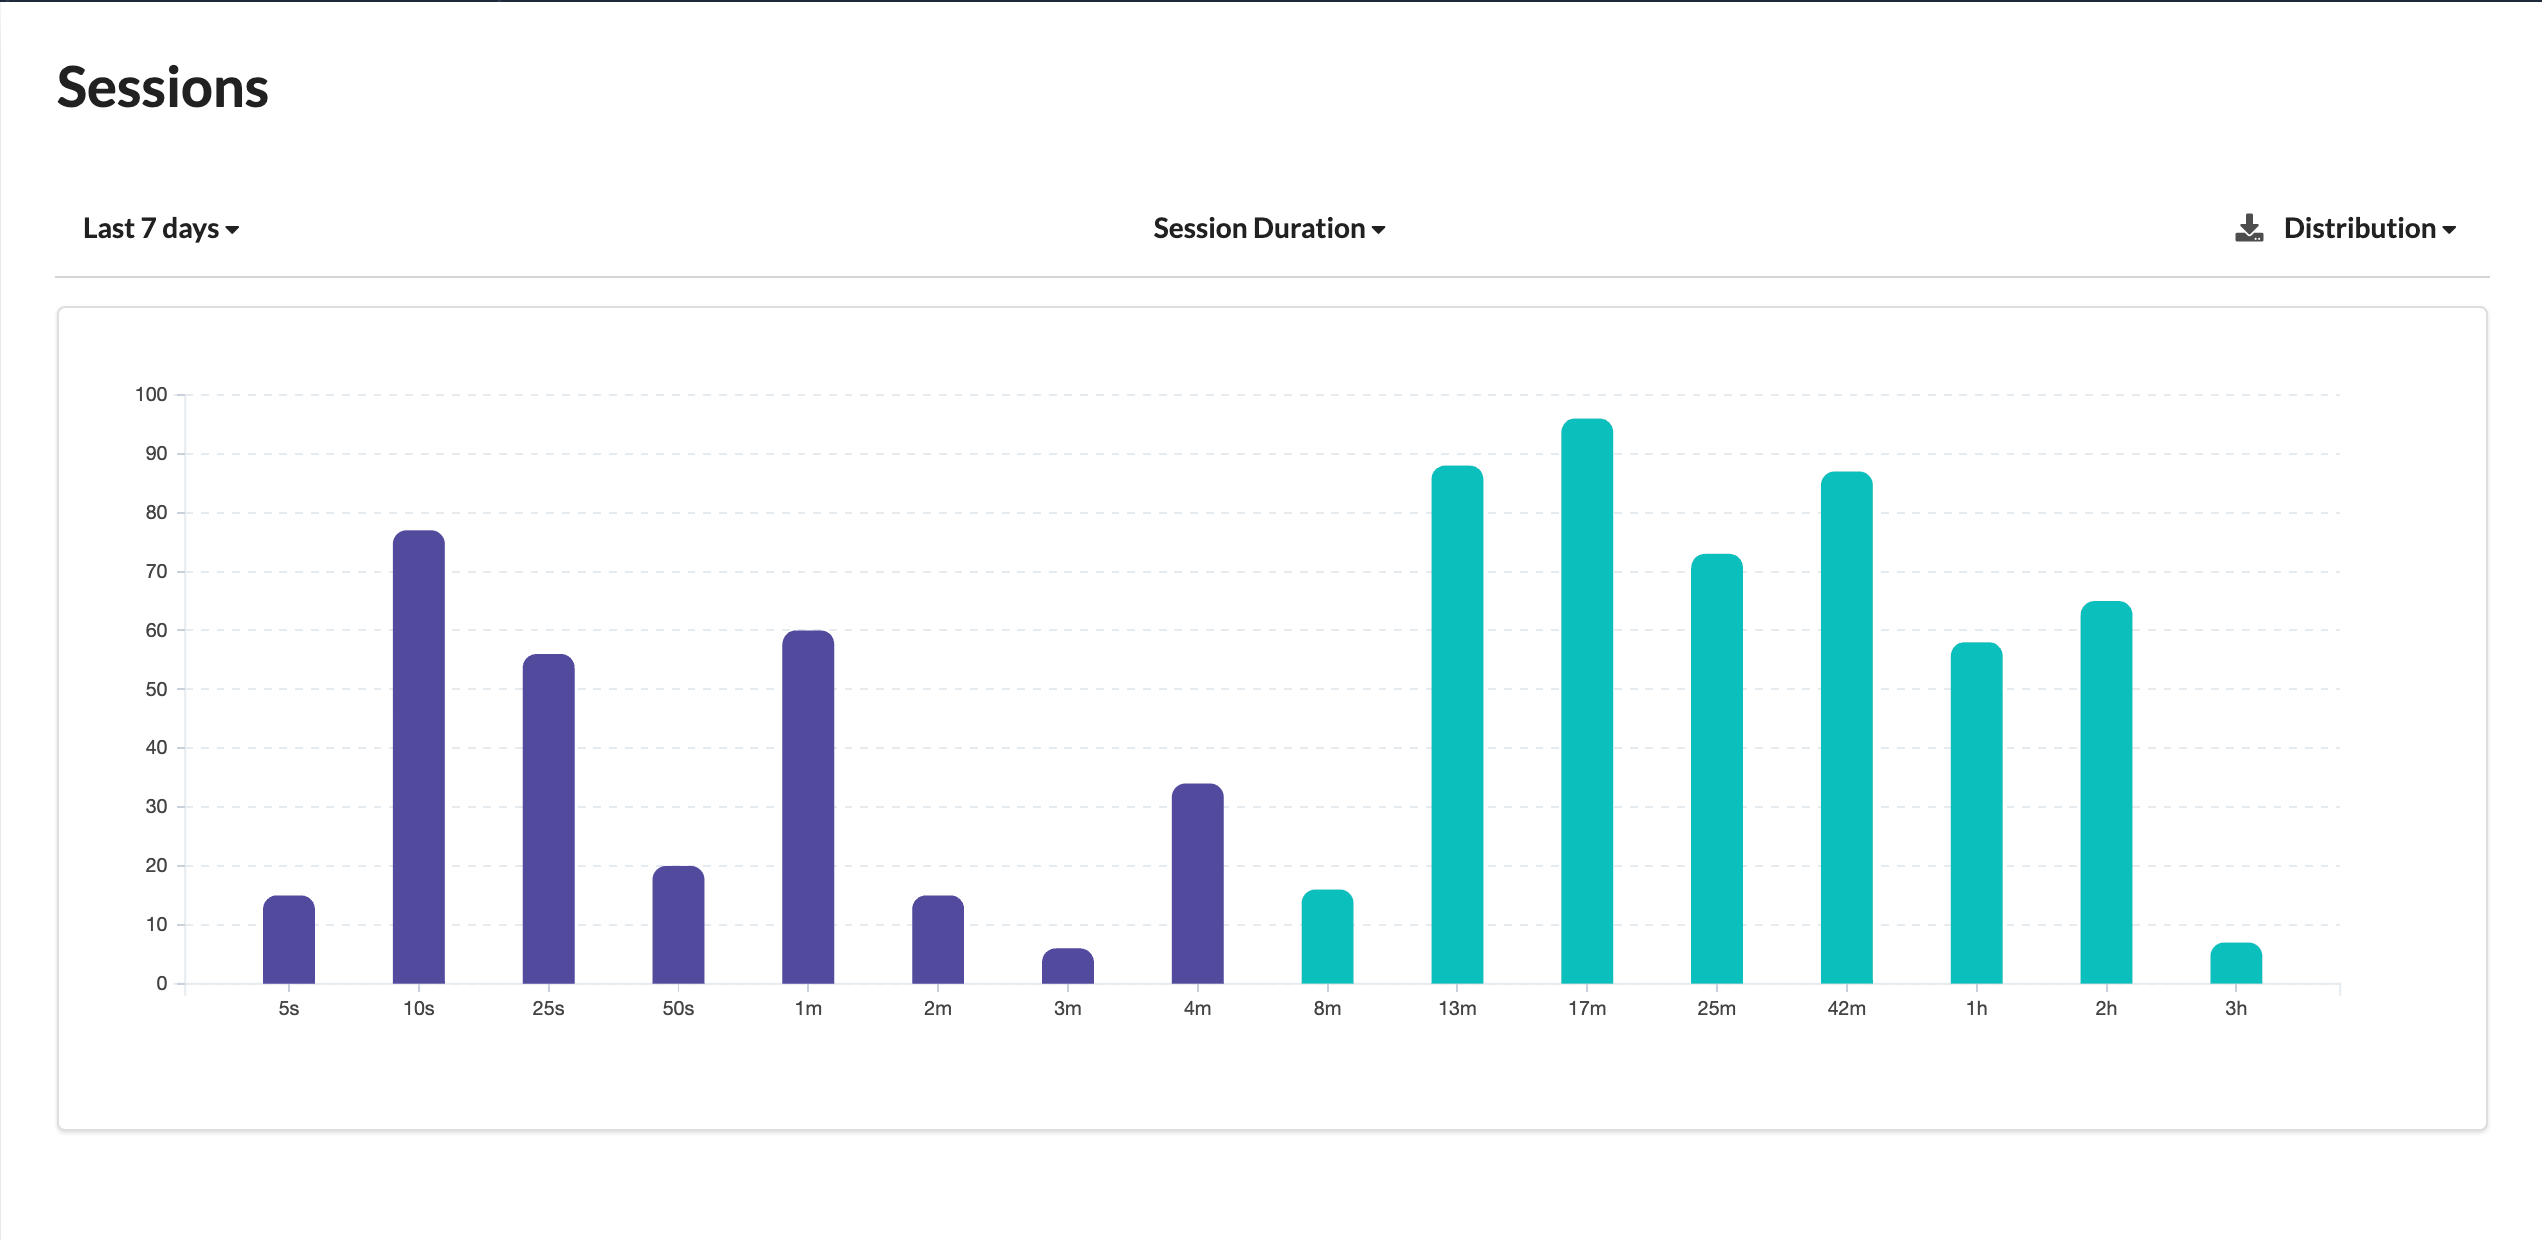
X-Axis (Duration Bins)
The x-axis represents different time duration bins or intervals. These intervals are typically segmented into seconds, minutes, or hours, depending on the context and the expected duration of chatbot sessions.
Y-Axis (Frequency or Proportion)
The y-axis displays the frequency or proportion of user sessions falling within each duration bin. It illustrates how many sessions or what percentage of sessions had a particular duration.
Histogram Bars
Each histogram bar corresponds to a duration bin on the x-axis. The height of each bar indicates the number or proportion of sessions falling within that specific bin.
Distribution Shape
The overall shape of the distribution provides insights into user engagement:
-
Right-skewed: Indicates that most sessions are shorter, with only a few being long. This suggests that users often have brief interactions with the chatbot.
-
Left-skewed: Implies that most sessions are longer, with only a few being short. This suggests that users tend to have extended interactions with the chatbot.
-
Bell-shaped (Normal): Indicates a relatively even distribution of sessions across various durations, suggesting a balanced mix of short, medium, and long interactions.
Interpreting a Session Duration Distribution Graph
Peak Durations
Identifies the highest peak in the distribution, indicating the most common or typical session duration. Understanding the peak duration helps assess users' typical engagement with the chatbot.
Skewness
The skewness of the distribution provides insights into user behavior. For example, a right-skewed distribution suggests users engage the chatbot for quick queries or tasks.
Outliers
Identifies sessions with unusually long or short durations compared to the majority. Outliers can indicate exceptional user behavior or technical issues.
Session Length Patterns
Analyzing the graph over time helps identify trends and changes in user behavior. For instance, a shift toward longer sessions may indicate users finding more value in the chatbot.
Optimization Opportunities
Understanding session duration distribution guides chatbot improvements. For instance, if users tend to have short sessions, the chatbot may need enhancements to keep users engaged for longer.
Use Cases for Session Duration Distribution Analysis
User Engagement Assessment
Evaluates the chatbot's ability to engage users effectively and identifies areas for improvement in user interaction design.
Content and Response Evaluation
Assesses whether chatbot responses are efficient and whether users find the information they need quickly.
A/B Testing
Uses session duration distribution as a metric to compare the effectiveness of different chatbot versions.
Customer Support
Monitors session duration to evaluate the efficiency of issue resolution and identify potential bottlenecks in customer support.
Summary
In summary, a Session Duration Distribution graph for a chatbot provides valuable insights into user engagement patterns, aiding chatbot developers and operators in optimizing user interactions, content, and design to enhance the overall user experience.