Power User Histogram (L30)
A "Power User Histogram" for a chatbot, focusing on "L30," typically refers to a graphical representation of user engagement and activity within the chatbot platform. In this context, "L30" often signifies the top or most active users who have had a significant number of interactions with the chatbot.
Explanation of Components and Significance:
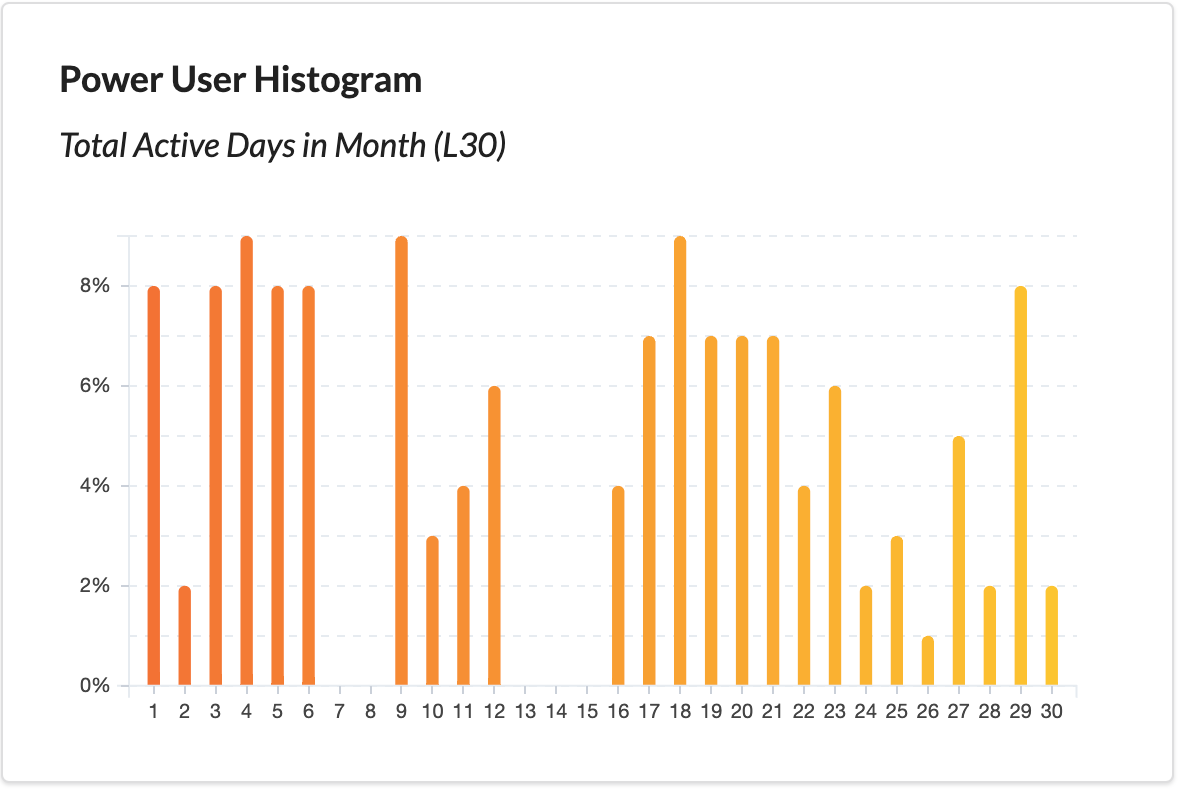
X-Axis (Bins or Categories)
The X-axis of the histogram typically represents different engagement levels or activity categories. For L30, these categories would represent various tiers of user activity, often measured by the number of interactions or sessions with the chatbot.
Y-Axis (Frequency or Count)
The Y-axis represents the frequency or count of users falling into each engagement level or activity category. It indicates how many users have a specific level of activity with the chatbot.
Histogram Bars
Each bar in the histogram represents a specific engagement level or activity category (e.g., number of interactions or sessions). The height of the bar corresponds to the number of users who fall within that category.
Significance:
Identifying Power Users
The histogram helps identify the chatbot's "power users" or the most engaged users. These users have interacted extensively with the chatbot, providing valuable insights into user behavior.
User Segmentation
By categorizing users into different activity levels (bins or categories), the histogram provides insights into user segmentation based on engagement. This information can inform personalized targeting or engagement strategies.
Retention Analysis
Analyzing the histogram over time can reveal trends in user engagement and whether there are consistent power users or if engagement levels change over time.
User Support
Recognizing power users is crucial for providing specialized support or assistance, as they may have more complex or frequent interactions with the chatbot.
Product Improvement
Understanding the behavior of power users can inform chatbot improvements, such as identifying which features or content are most appealing to this user segment.
Usage Patterns
The histogram can highlight usage patterns, such as spikes in engagement at specific activity levels. These patterns may indicate successful marketing campaigns, feature releases, or user outreach efforts.
Summary
In summary, a Power User Histogram for L30 in a chatbot provides a visual representation of user engagement levels, assisting chatbot developers, marketers, and support teams in gaining insights into user behavior and tailoring their strategies accordingly. It highlights the most active users and allows for data-driven decision-making to improve the chatbot's performance and user experience.