Message Volume by Channel
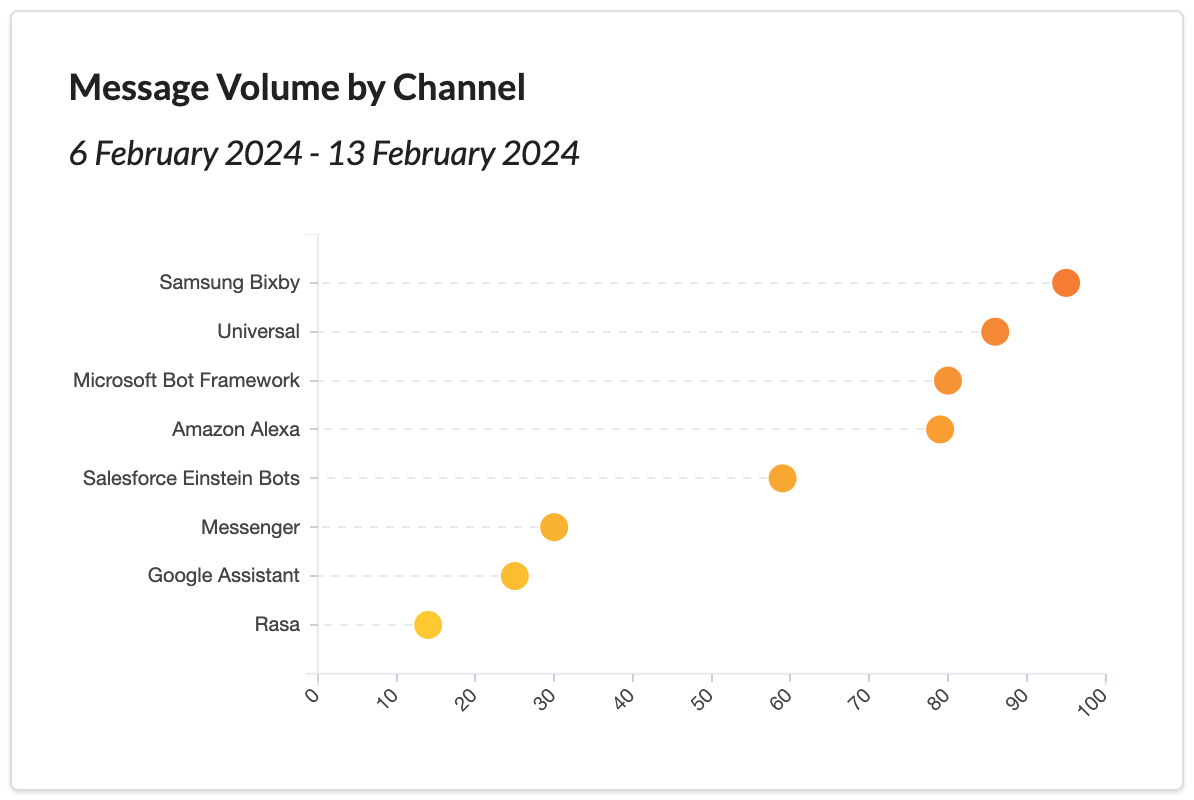
A "Message Volume by Channel" horizontal bar graph for the current week in a chatbot analytics dashboard displays the distribution of messages across various communication channels and integration channels specifically for the ongoing week.
Here's an explanation of this dynamic graph:
Y-Axis (Channels and Integration Channels)
On the Y-axis, you have a list of communication channels and integration channels, including:
- Facebook Messenger
- Amazon Alexa
- Google Assistant
- Samsung Bixby
- Microsoft Bot Framework
- Rasa and Others.
These represent the mediums through which users interact with the chatbot.
X-Axis (Number of Messages)
The X-axis represents the number of messages sent or received by each specific channel or integration platform. It's a quantitative measure, typically showing message counts.
Horizontal Bar Graph
Each channel or integration platform is represented as a horizontal bar in the graph. The length or height of each bar corresponds to the number of messages associated with that channel during the current week. Longer bars indicate a higher volume of messages for that specific channel or platform.
Significance and Use Cases
Real-time Insights
Focusing on the current week provides real-time insights into message distribution, helping you stay updated on the latest trends and user interactions.
Weekly Trends
You can monitor weekly trends in message volume by channel, which can reveal patterns related to user engagement, marketing campaigns, or platform-specific events.
Resource Allocation
Identifying channels with high message volumes in the current week allows you to allocate resources effectively for ongoing support and development efforts.
Performance Evaluation
It helps evaluate the immediate impact of any changes or updates made to specific channels or integration channels during the current week.
Channel-Specific Strategies
Based on the data, you can formulate channel-specific strategies for improving user engagement or addressing issues.
Campaign Assessment
If you've run specific campaigns or promotions during the week, you can assess their effectiveness by examining message volumes on relevant channels.
User Engagement
Identifying channels with low message volumes during the week may warrant efforts to boost user engagement on those channels.
Summary
In summary, a Message Volume by Channel horizontal bar graph for the current week provides an up-to-date view of message distribution across various communication channels and integration platforms. This information is invaluable for making real-time decisions related to resource allocation, user engagement, and overall chatbot performance enhancement.