Message Volume by Day
A "Message Volume by Day" line graph for a chatbot displays data related to the combined message counts from various communication channels and integration platforms over a specified period. In this case, let's consider a one-week period starting from Monday, January 1st, and ending on Sunday, January 7th.
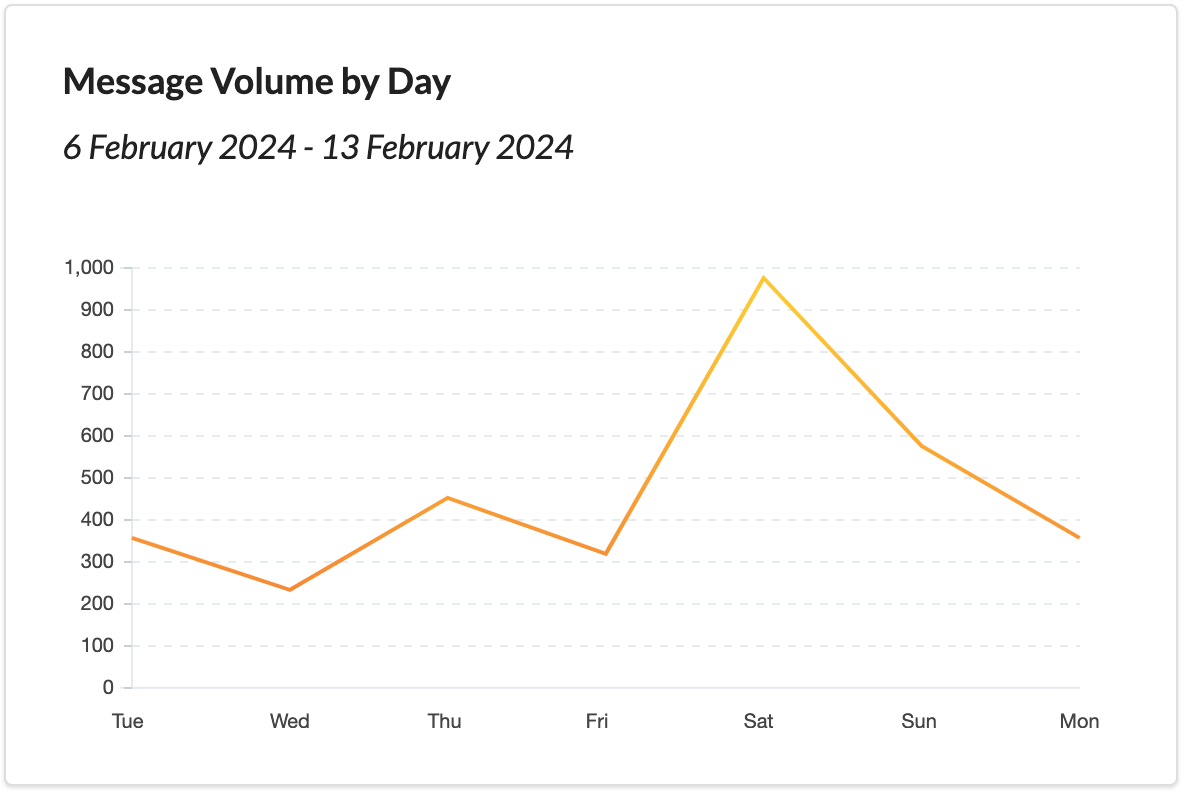
Y-Axis (Combined Message Counts)
The Y-axis represents the total number of messages received or sent across all communication channels and integration platforms. It measures the overall message volume, with each data point indicating the combined message counts for a specific day.
X-Axis (Weekdays)
The X-axis represents the weekdays over the past week, starting from Monday (January 1st) and progressing through Tuesday, Wednesday, Thursday, Friday, Saturday, and ending on Sunday (January 7th). Each day corresponds to a data point on the graph.
Line Graph
The data points on the graph are connected by a line, forming a line graph. Each point on the line represents the combined message counts for a specific day of the past week.
Significance and Use Cases
Message Volume Trends
The graph allows you to visualize daily trends in message volume over the past week, helping you understand which days experienced higher or lower message activity.
Resource Allocation
Observing message volume patterns can inform resource allocation decisions, such as scheduling support staff or chatbot maintenance during peak message hours.
Performance Evaluation
Monitoring message volume provides insights into chatbot performance and user engagement. Sudden spikes or drops may require investigation.
Integration Platform Analysis
By aggregating message counts from both communication channels and integration platforms, you can assess the success and usage of different integrations.
Data-Driven Decision-Making
The graph offers data that can drive informed decisions related to scaling, user support, and chatbot enhancements based on message activity.
Comparative Analysis
You can compare message volume data for the current week with data from previous weeks to identify trends, seasonality, or deviations.
User Engagement Strategies
Understanding message volume patterns can help tailor user engagement strategies, such as chatbot responses or notifications, to specific days or times.
Summary
In summary, a "Message Volume by Day" line graph for a chatbot covering the past week's data provides a visual representation of message volume trends across all communication channels and integration platforms. This information is valuable for making data-driven decisions related to resource allocation, user engagement, and chatbot performance improvement.