Power Users Histogram in Chatbots
A "Power Users Histogram" for a chatbot is a graphical representation illustrating the distribution of user activity levels within the chatbot's user base. It serves as a valuable tool for identifying and categorizing users based on their engagement and interaction patterns with the chatbot.
Elements of a Power Users Histogram
-
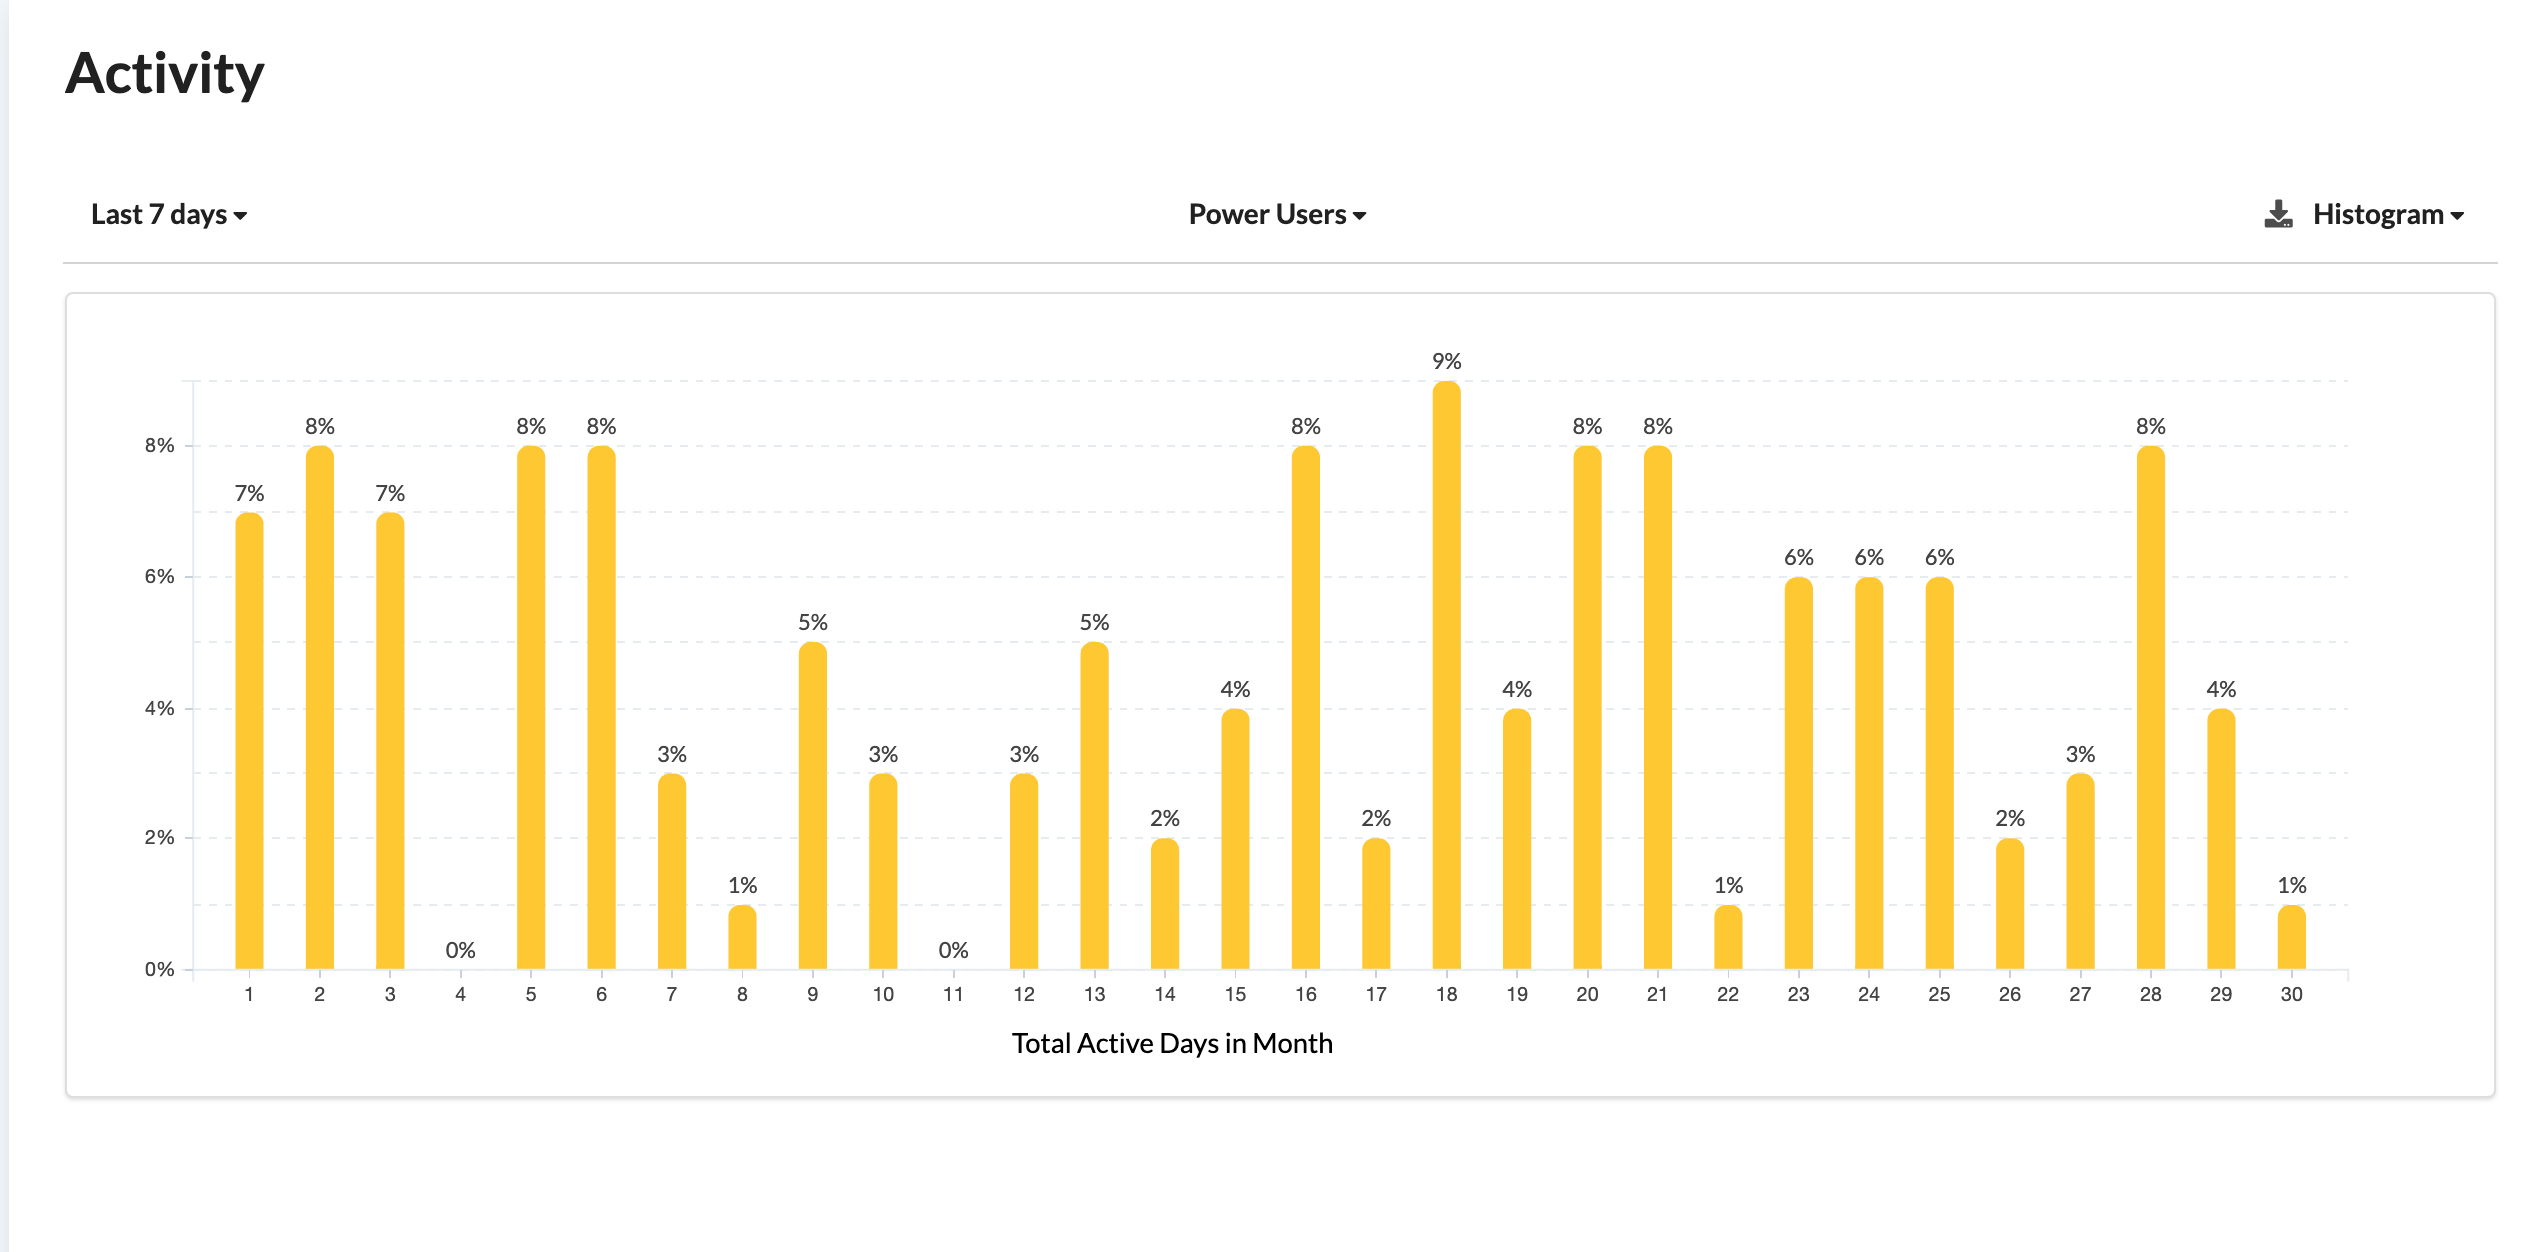
X-Axis: Represents user activity levels or engagement metrics, such as the number of interactions, messages sent, or tasks completed by users.
-
Y-Axis: Indicates the number or percentage of users falling within each activity level range.
-
Histogram Bars: Each bar represents different ranges of user activity levels, with the height of the bar corresponding to the number or percentage of users in that range.
Interpretation of a Power Users Histogram
-
Distribution of User Activity: Provides a visual overview of how user activity is distributed across different levels within the chatbot's user base.
-
Identification of Power Users: Highly engaged users, known as power users, are typically found in the rightmost bars of the histogram, indicating their frequent and extensive use of the chatbot.
-
Segmentation: Enables segmentation of users into categories based on their activity levels, facilitating tailored engagement strategies and personalized experiences.
-
Understanding Engagement Patterns: Offers insights into user engagement patterns, such as identifying whether a large portion of users is highly active or if there's a significant number of users with low activity levels.
-
Retention and Growth: Helps assess user retention and growth, with a higher percentage of users in the high activity range indicating effective user engagement and retention efforts.
-
Targeted Engagement Strategies: Informs the development of targeted engagement strategies, such as personalized messages or incentives, based on user activity levels.
-
Improvement Opportunities: Identifies opportunities for improving user engagement, onboarding processes, or feature utilization, particularly for users with low activity levels.
-
Benchmarking: Allows for tracking changes in user engagement over time and assessing the impact of updates or enhancements to the chatbot.
Use Cases for a Power Users Histogram
-
Personalization: Enables personalized interactions and content recommendations tailored to power users to maintain their engagement.
-
Retention Strategies: Focuses on retaining highly engaged users through loyalty programs or exclusive content offerings.
-
Onboarding Improvements: Guides improvements in onboarding processes to increase engagement, particularly for users with lower activity levels.
-
Content Recommendations: Facilitates tailored content recommendations for different user segments based on their activity levels.
Summary
In summary, a Power Users Histogram for a chatbot provides insights into user engagement levels, allowing for the identification of power users and the development of targeted engagement strategies. This visual representation aids in improving user retention, enhancing personalized experiences, and optimizing the overall effectiveness of the chatbot.