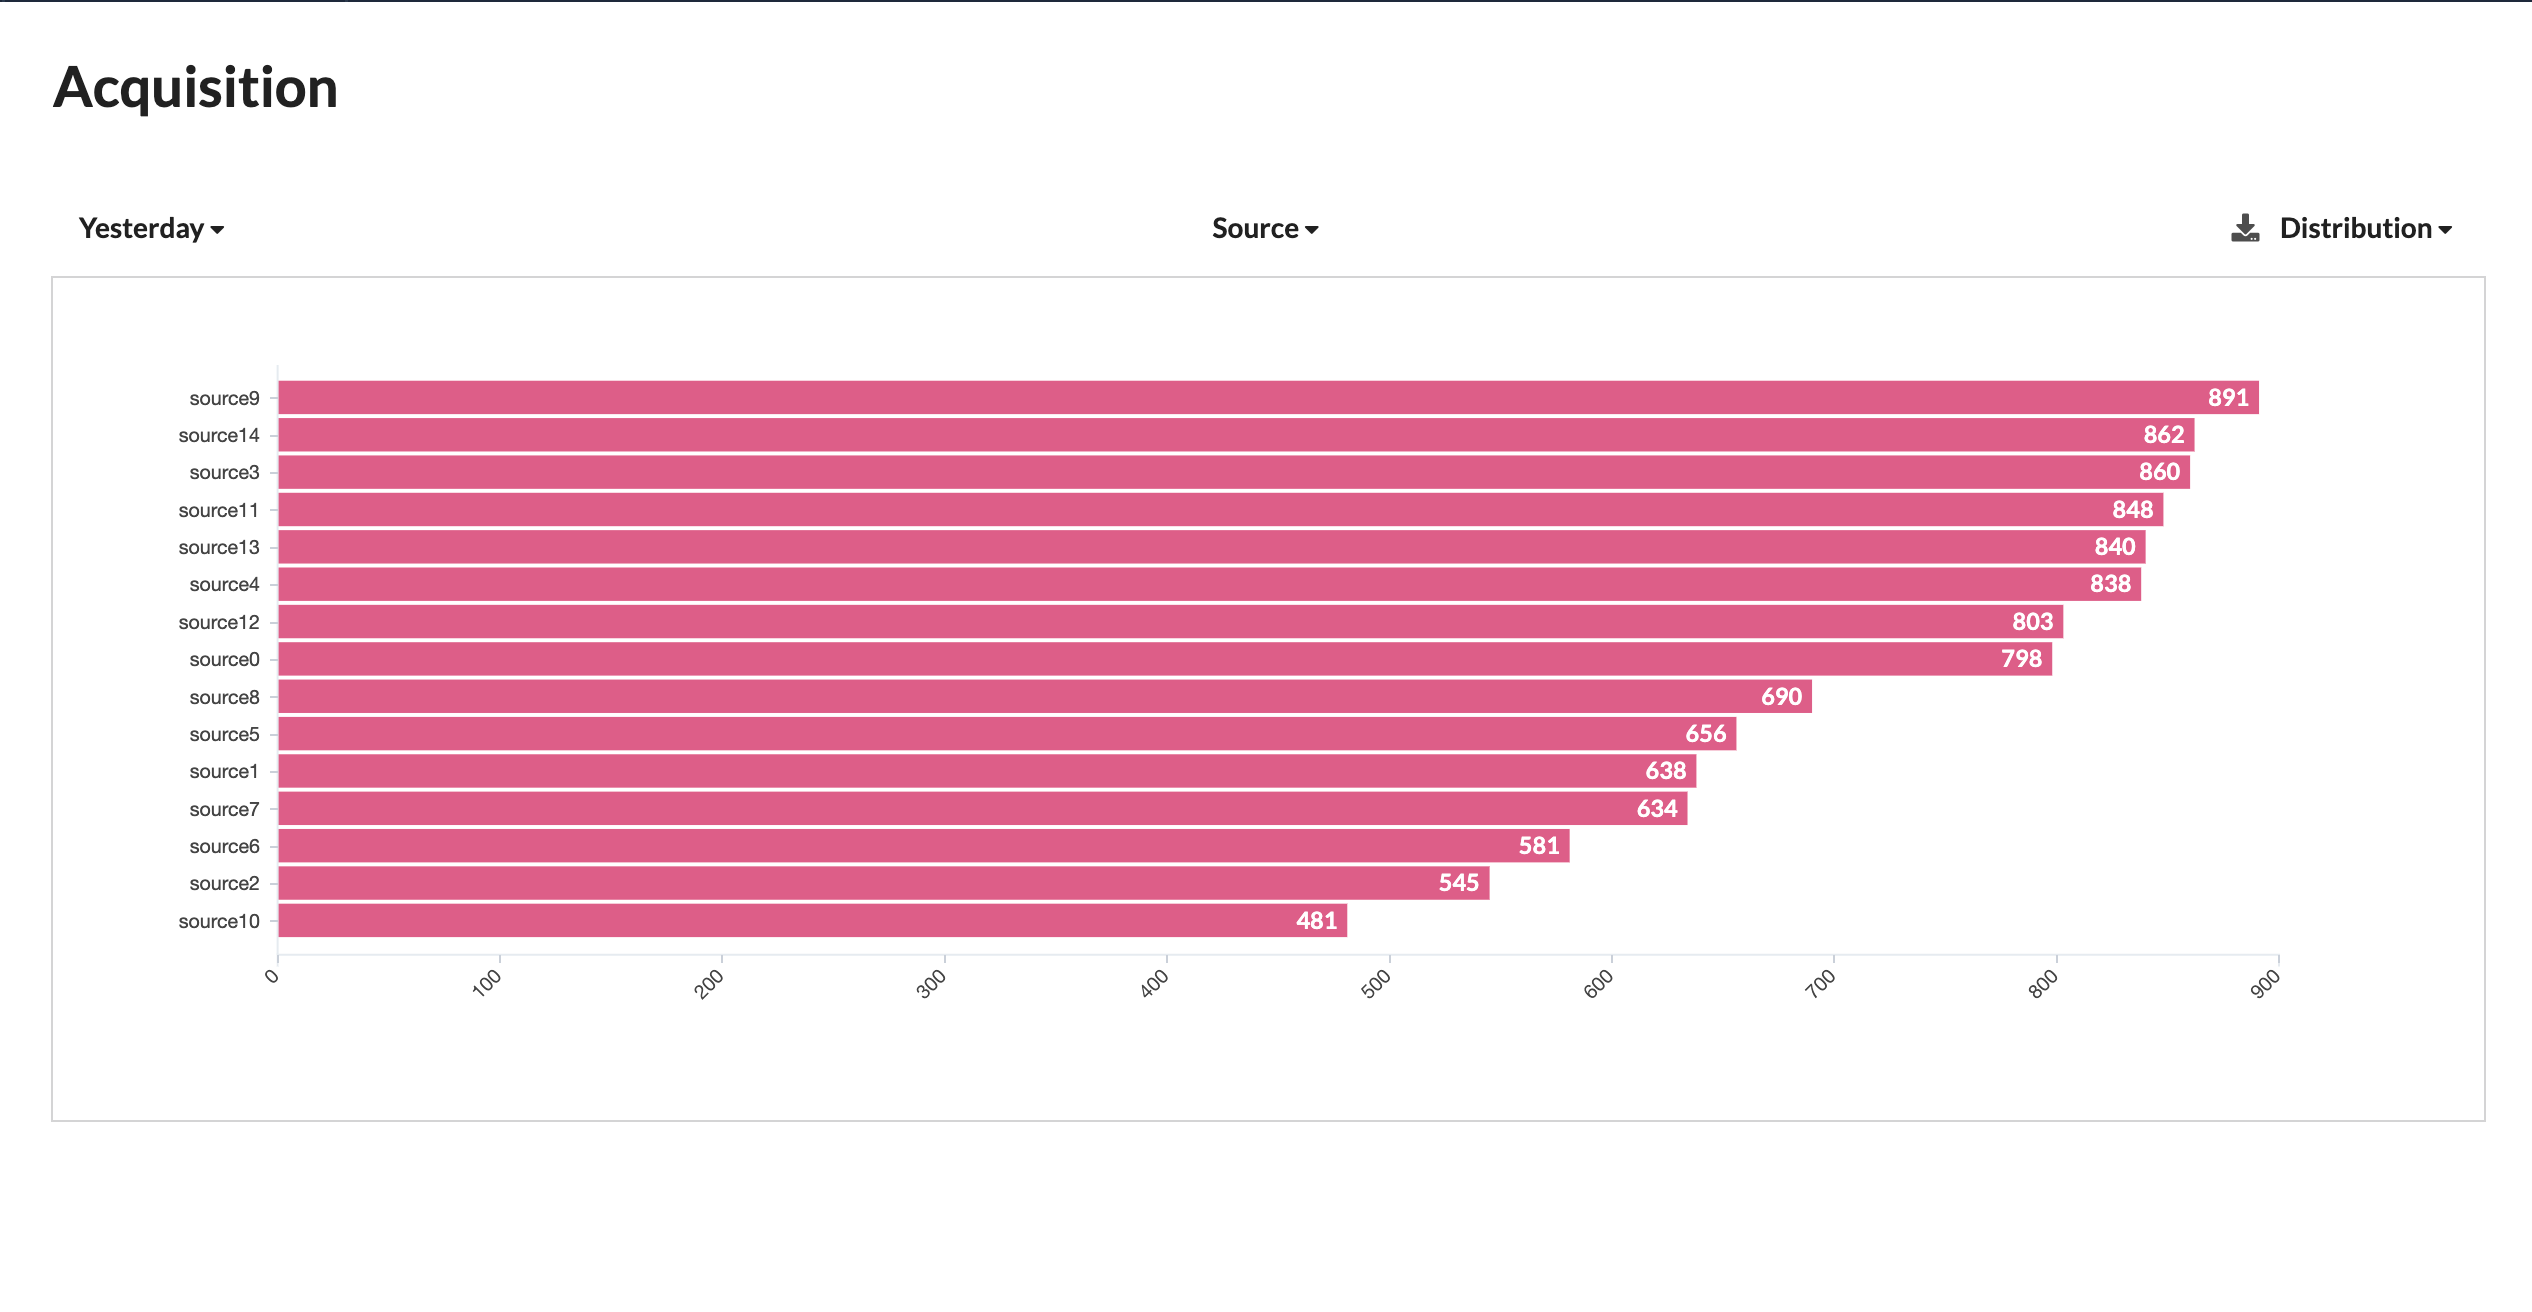
Acquisition Source Horizontal Distribution Bar Graph
An Acquisition Source Horizontal Distribution Bar Graph for a chatbot is a visual representation that displays the distribution of user acquisition across different sources or channels in a horizontal format. It provides a clear view of how many users were acquired through each source, allowing for easy comparison and identification of the most effective acquisition channels for the chatbot.
Key Elements
Horizontal Bars
Each horizontal bar represents a specific acquisition source or channel.
Source Labels
Beside each bar, there is typically a label or name representing the corresponding acquisition source.
Bar Length
The length of each bar corresponds to the number of users acquired through that source. Longer bars represent more users acquired, while shorter bars represent fewer users.
Significance and Usage
Visual Comparison
The horizontal bar graph allows for a visual comparison of the effectiveness of different acquisition sources or channels in terms of user acquisition.
Identify High-Performing Sources
Longer bars indicate high-performing sources, which are successful in attracting users to the chatbot.
Resource Allocation
Insights from the graph can help in allocating marketing resources and budget to the most effective acquisition sources, ensuring optimal return on investment (ROI).
Source Optimization
Marketers can make data-driven decisions to optimize underperforming sources and allocate more resources to high-performing ones based on the distribution.
Challenges and Considerations
Data Accuracy
Ensure that data tracking mechanisms accurately attribute users to the correct acquisition sources or channels.
Source Naming
Source labels should be clear and consistent to avoid confusion when interpreting the graph.
Limited Space
Choose a suitable graph format to accommodate all relevant sources without cluttering the graph.
Use Cases
Marketing Strategy Optimization
Identify the most effective acquisition sources or channels and allocate resources accordingly to optimize marketing strategies.
Source Assessment
Assess the success of specific acquisition sources or channels by analyzing how many users each source has contributed.
Resource Allocation
Inform decisions about resource allocation and budget for user acquisition to ensure optimal ROI for different sources.
Adaptation to Trends
Adapt marketing strategies based on evolving user acquisition trends and preferences indicated by the graph.
Summary
In summary, an Acquisition Source Horizontal Distribution Bar Graph visually presents the distribution of user acquisition across different sources or channels, aiding businesses in making informed decisions about resource allocation and source optimization in a horizontal format.