Acquisition Cohorts Grid
A "Retention by Acquisition Cohorts Grid" is a data analysis and visualization technique used to track and compare user retention rates over time, based on the cohorts of users acquired during specific time periods. In the context of a chatbot, this grid helps you understand how effectively your chatbot is retaining users who were acquired during different time frames.
Here's an explanation of the Retention by Acquisition Cohorts Grid for both 7 and 30 days:
Retention by Acquisition Cohorts Grid
Acquisition Cohorts
These are groups of users who were acquired during specific time periods. For example, you might have cohorts for users acquired in January, February, March, and so on.
Retention Rate
The retention rate measures the percentage of users from a particular cohort who continue to engage with the chatbot over a specified time period. It's calculated by dividing the number of users who are still active or engaged after the time period by the total number of users in the cohort.
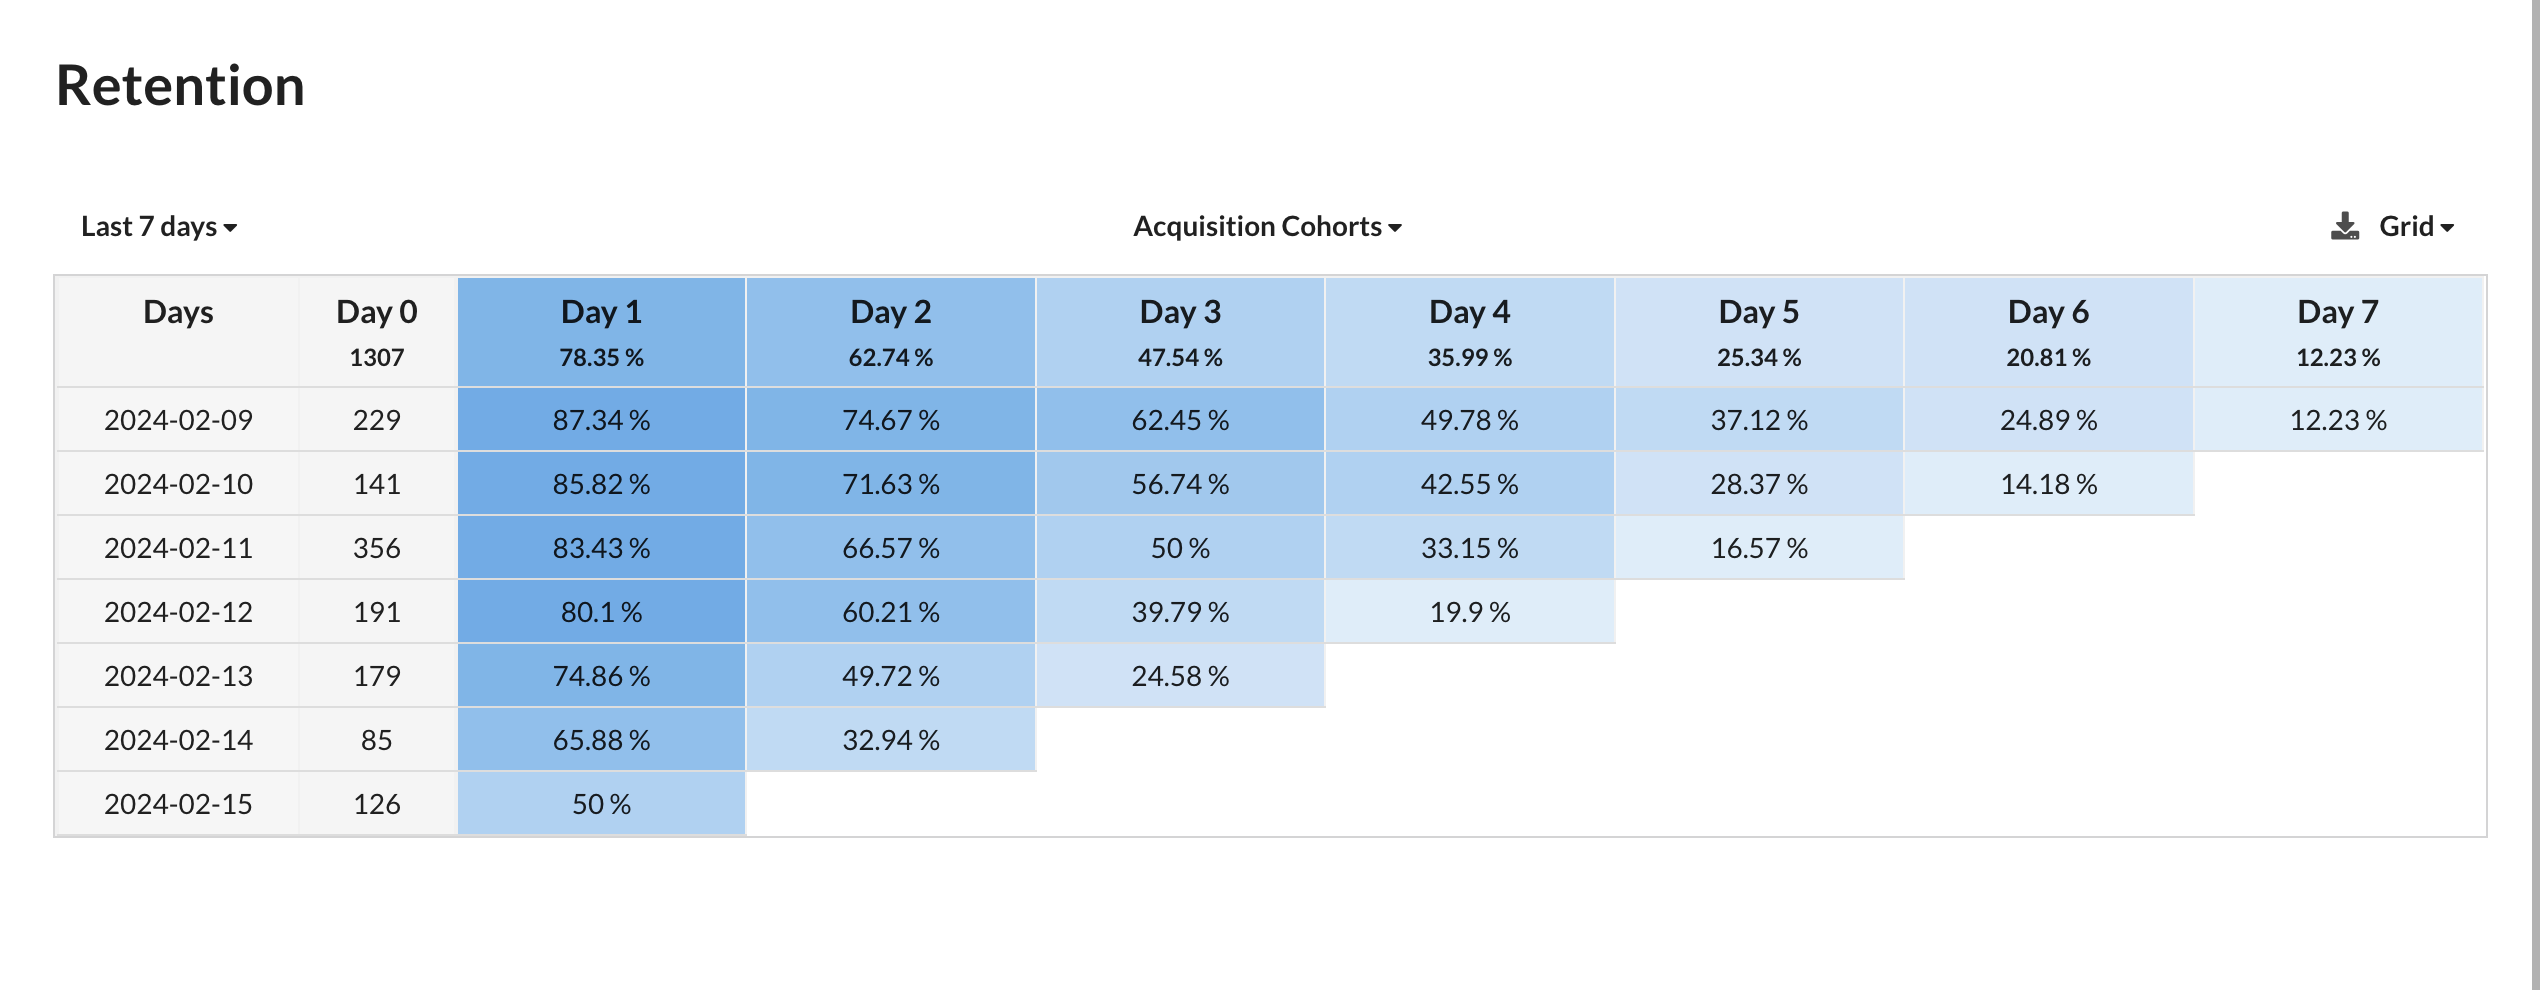
7-Day Retention by Acquisition Cohorts Grid
X-Axis
This represents the acquisition cohorts, typically labeled by the month or week when users were acquired.
Y-Axis
This represents the retention rate, usually in percentage form.
Grid Cells
Each cell in the grid corresponds to a specific acquisition cohort and a specific 7-day retention rate. For example, the cell at the intersection of "January" and "60%" might indicate that 60% of users acquired in January were still active after 7 days.
30-Day Retention by Acquisition Cohorts Grid
X-Axis
Similar to the 7-day grid, this represents the acquisition cohorts, labeled by the month or week when users were acquired.
Y-Axis
This represents the retention rate, but over a 30-day period.
Grid Cells
Each cell in the 30-day grid corresponds to a specific acquisition cohort and a specific 30-day retention rate. For example, the cell at the intersection of "February" and "45%" might indicate that 45% of users acquired in February were still active after 30 days.
Interpreting the Grid
The grid allows you to compare the retention performance of different acquisition cohorts. You can see whether users acquired during certain months or weeks tend to stick around and engage with the chatbot for longer periods.
High retention rates in specific cohorts suggest that your chatbot was successful in retaining users acquired during those periods.
Low retention rates in certain cohorts might indicate issues with onboarding, engagement strategies, or the overall user experience.
The grid helps you identify trends and patterns over time. For example, you might notice that users acquired in the summer months have higher retention rates than those acquired in the winter.
By analyzing the grid, you can make informed decisions about when and how to acquire users, as well as how to improve user retention strategies.
The 7-day and 30-day grids provide insights into short-term and longer-term retention, respectively, allowing you to assess user engagement over different time horizons.
Summary
In summary, the Retention by Acquisition Cohorts Grid for 7 and 30 days in a chatbot context helps you track and compare user retention rates for different cohorts of users. It's a valuable tool for assessing the effectiveness of your chatbot's user acquisition and retention strategies over time.