Demographics Device Capabilities
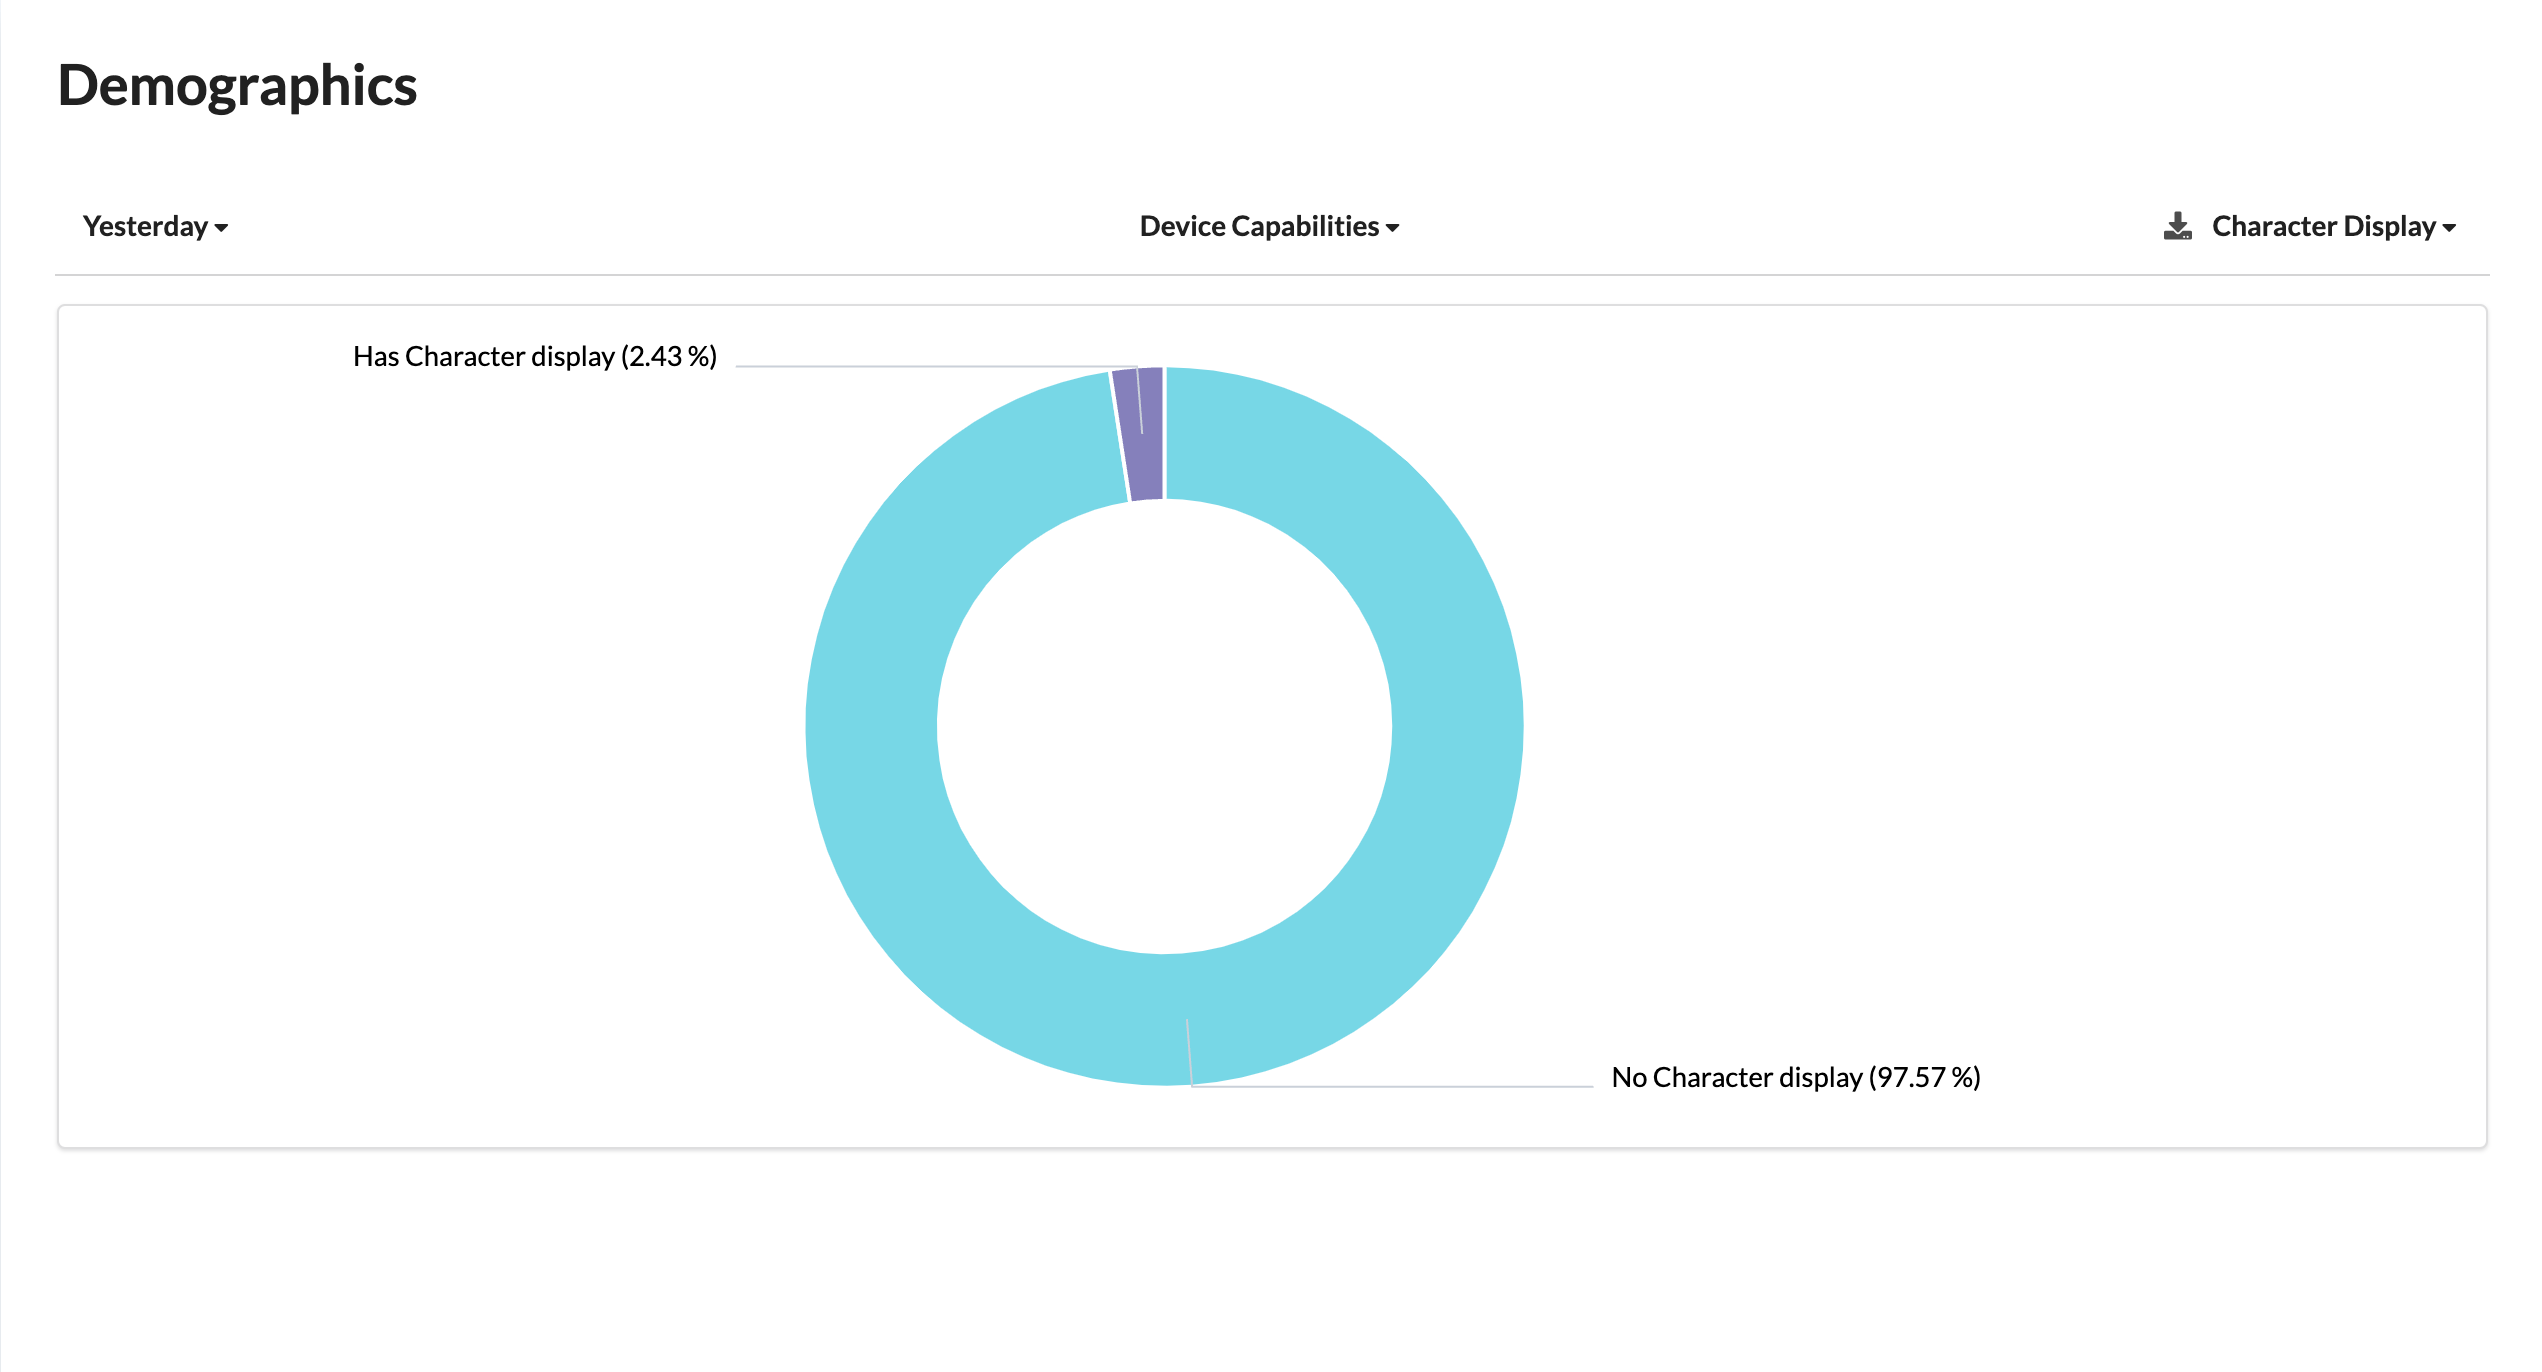
A Device Capabilities Circle Pie Chart for a chatbot is a visual representation that displays the distribution of user device capabilities across various categories such as Screen, Audio, Video, Web Browser, and Character Display. It provides insights into the device capabilities of chatbot users and how they are distributed among these categories. Additionally, it allows users to select specific categories and view the percentages of users who possess or lack those capabilities within the selected category. Here's an explanation of the key elements and how it works:
Key Elements
Circle Pie Chart
The primary element of the graph is a circular chart divided into segments, with each segment representing one of the device capability categories.
Categories
The categories listed in the chart include
Screen
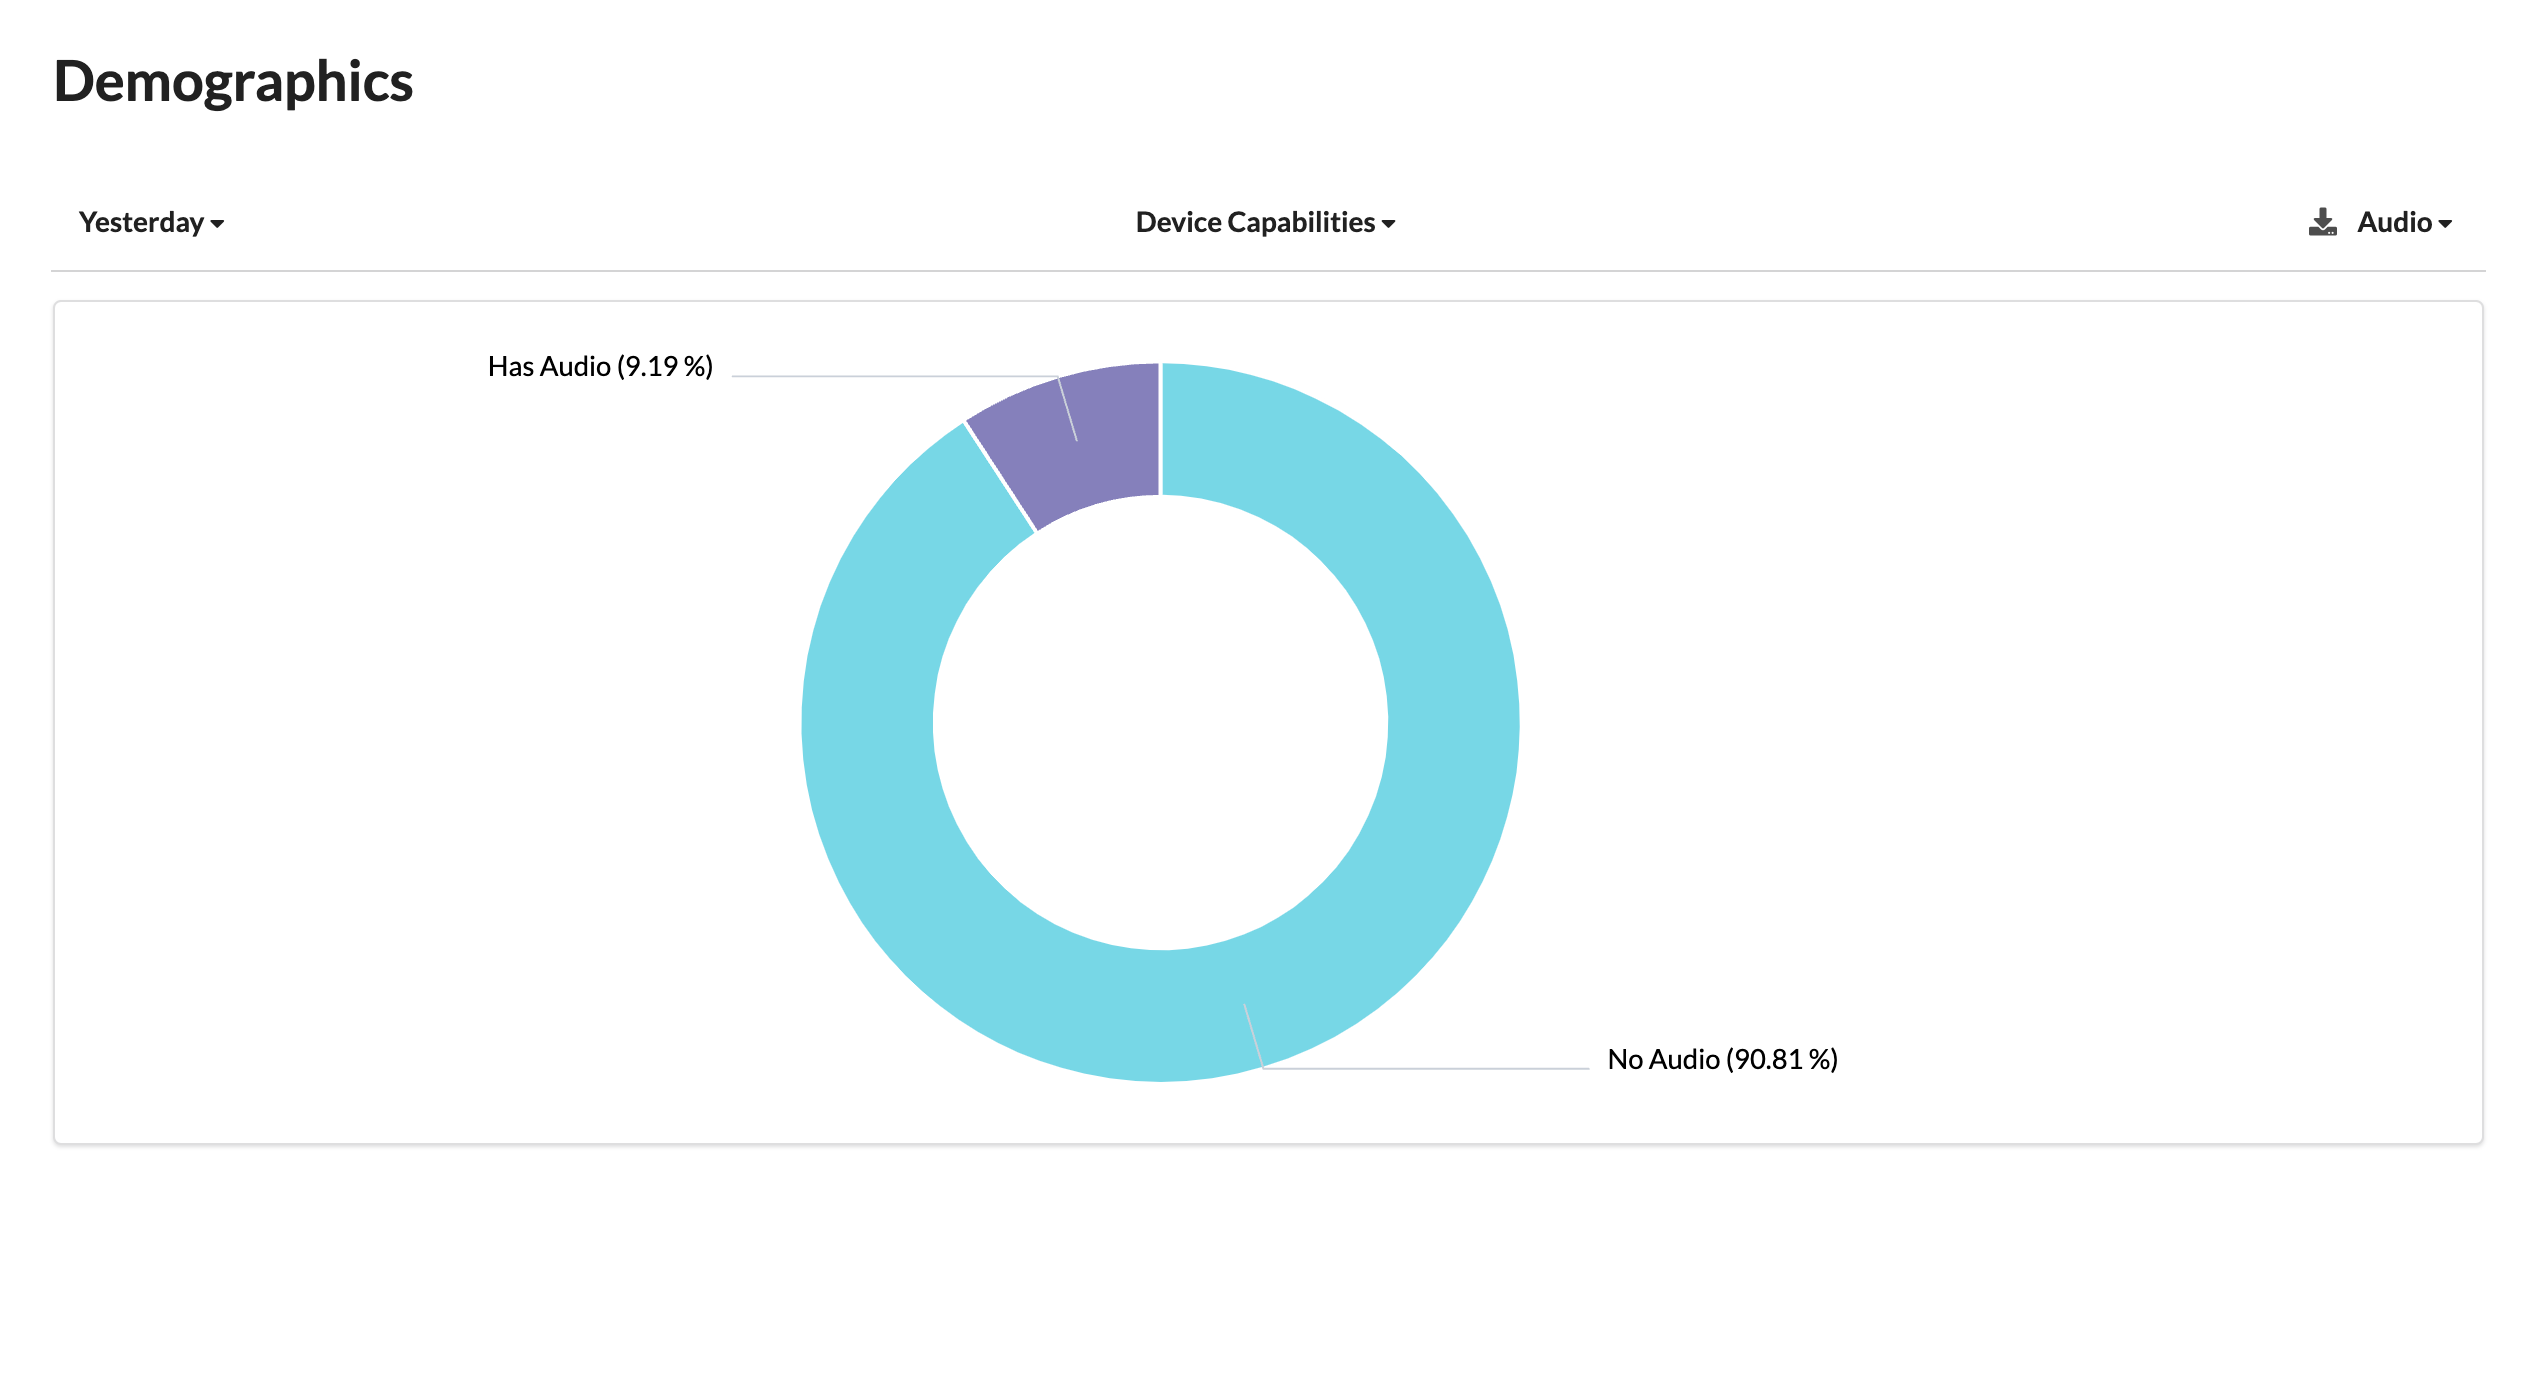
Audio
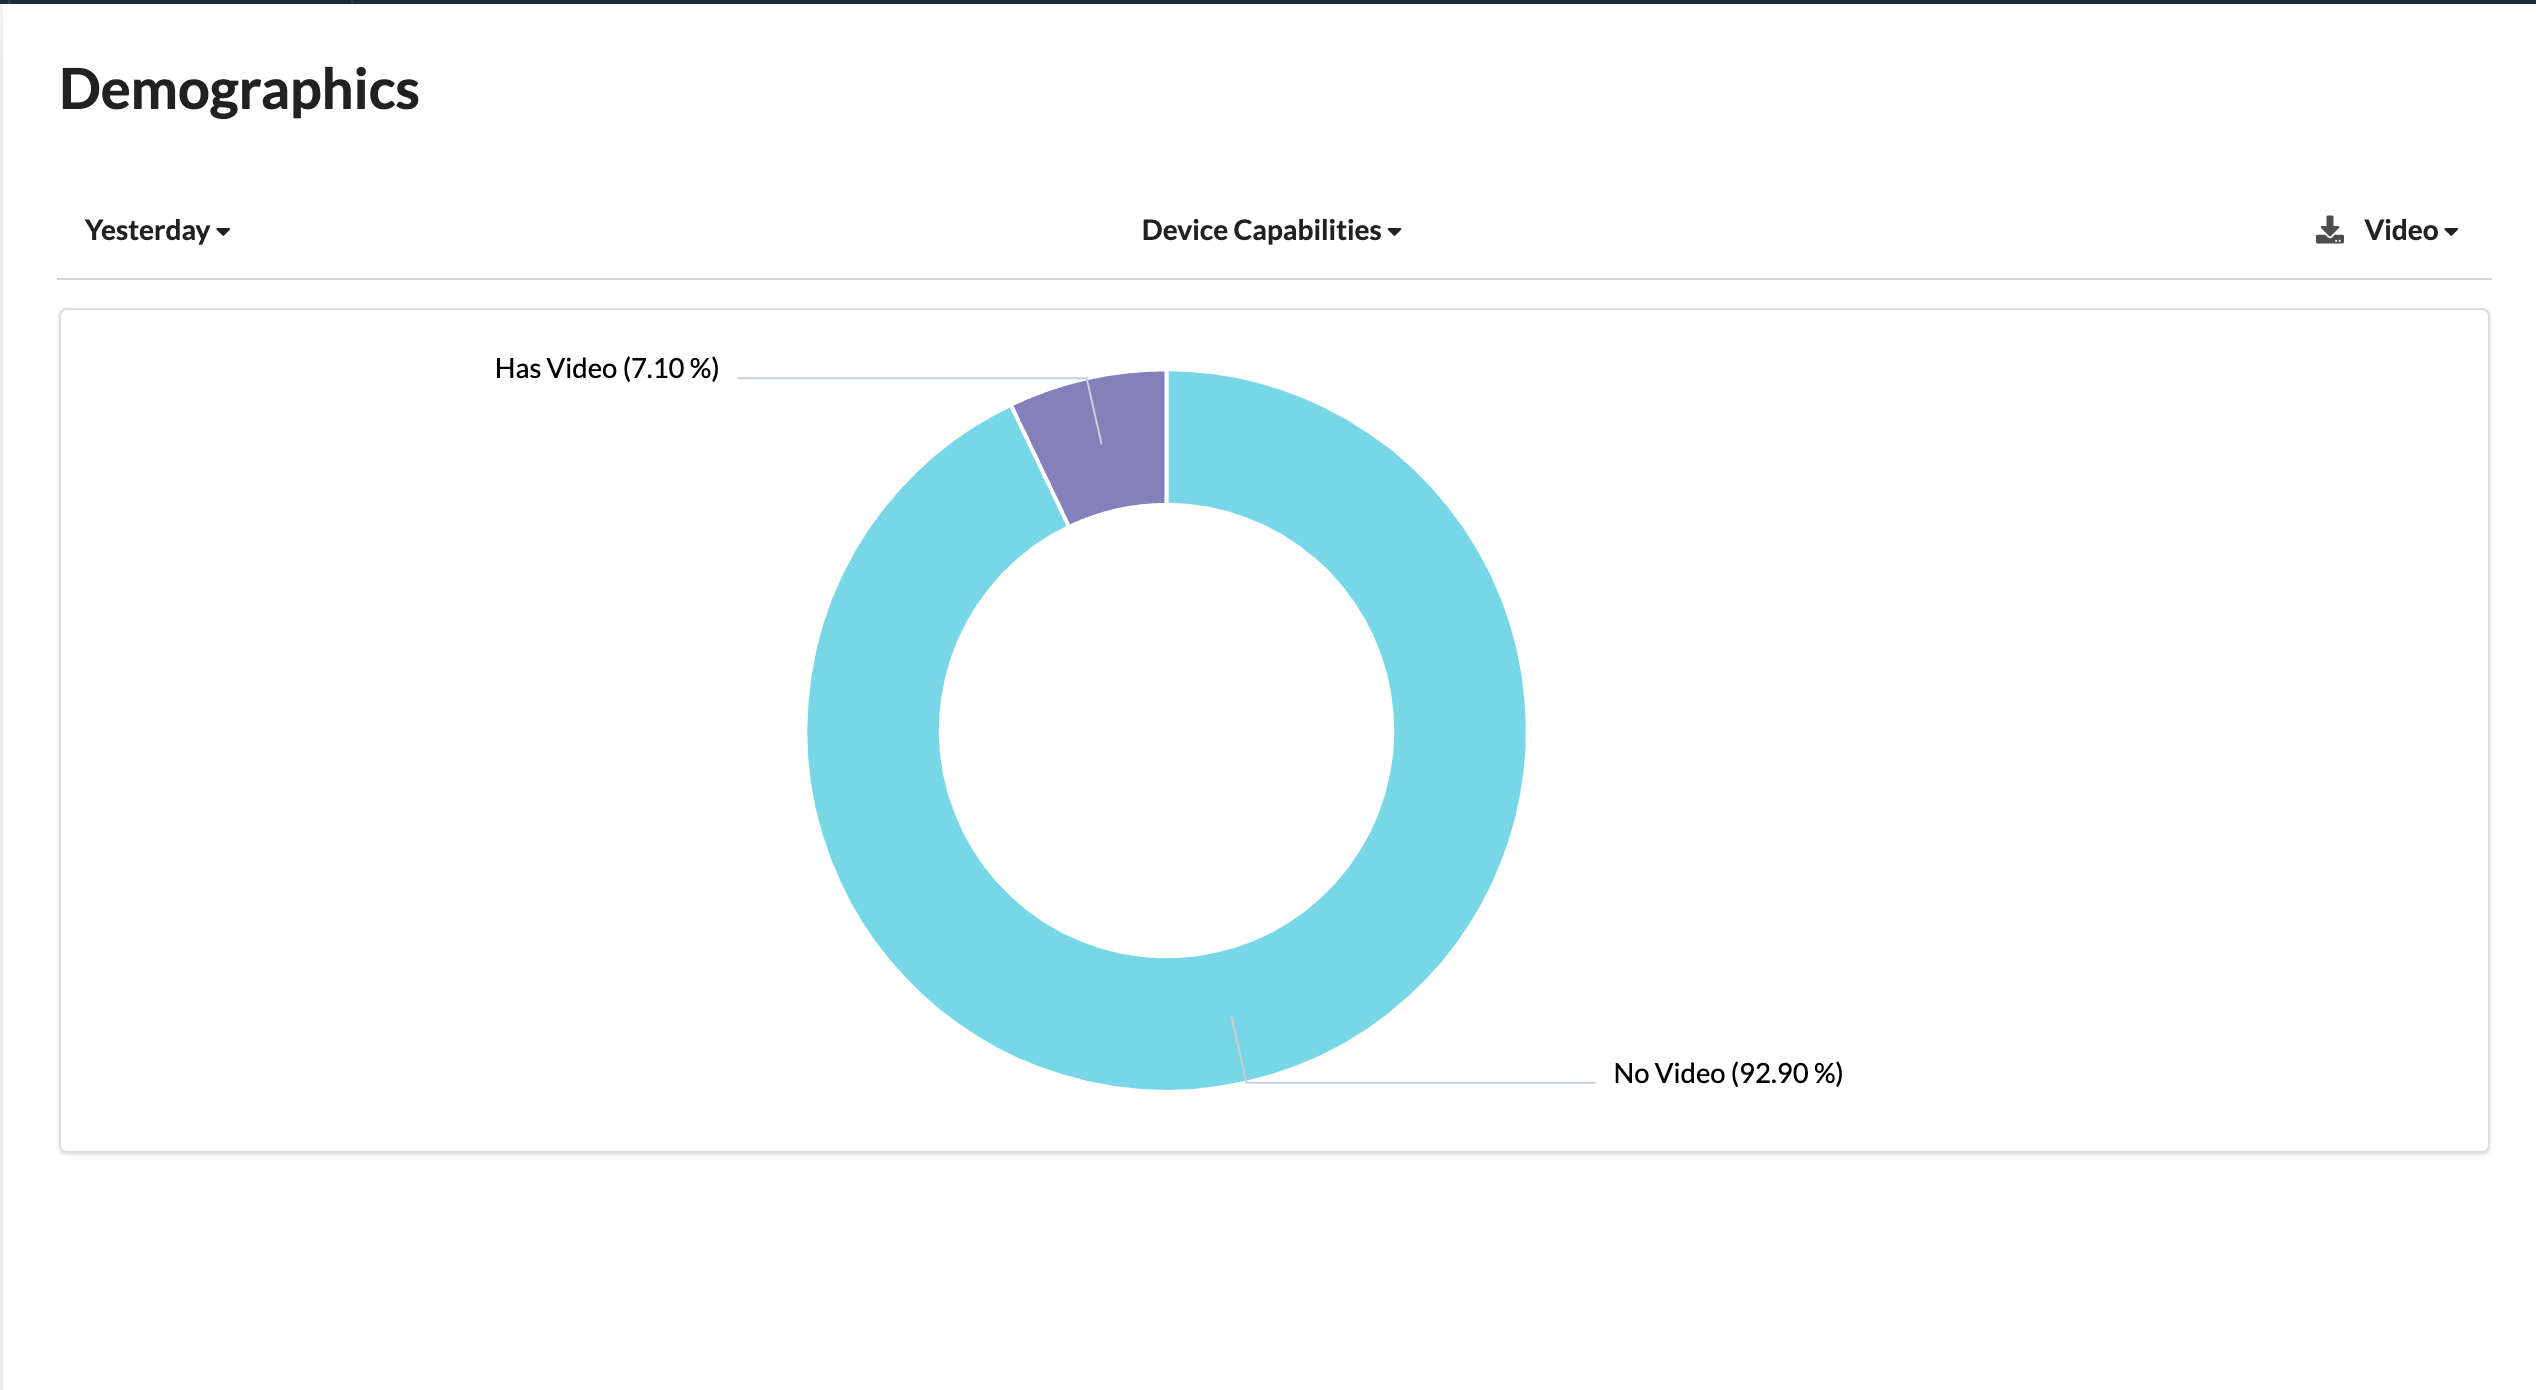
Video
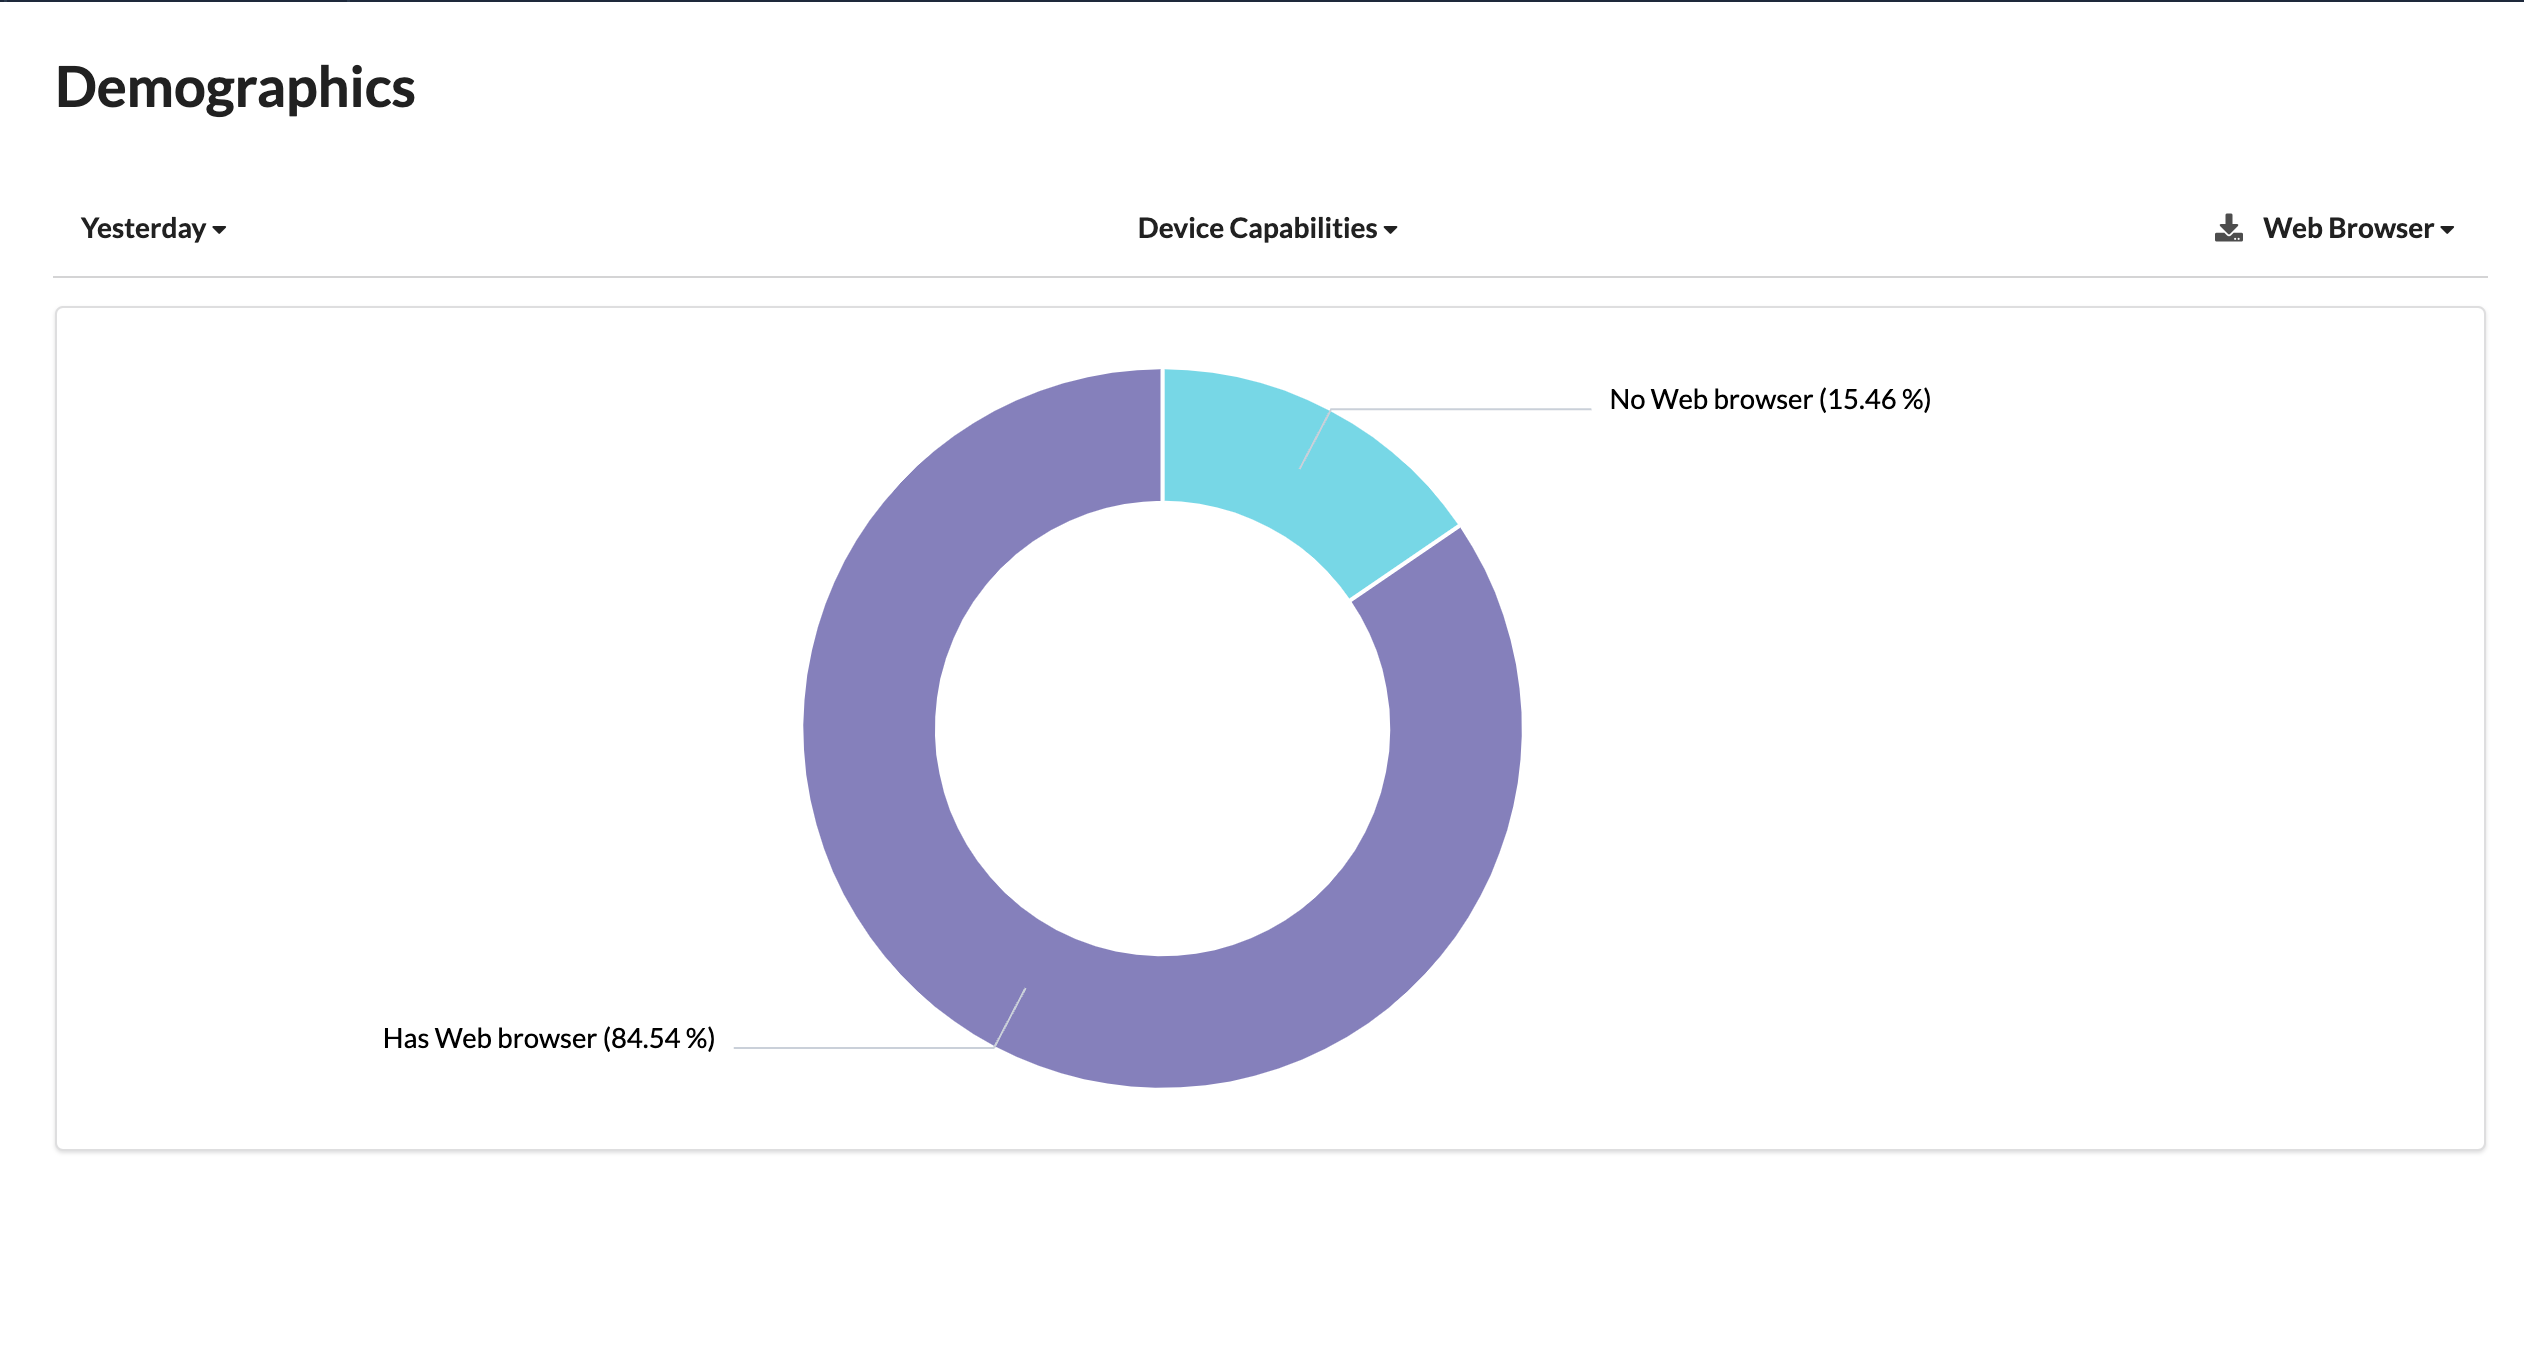
Web Browser
Character Display.
Percentages
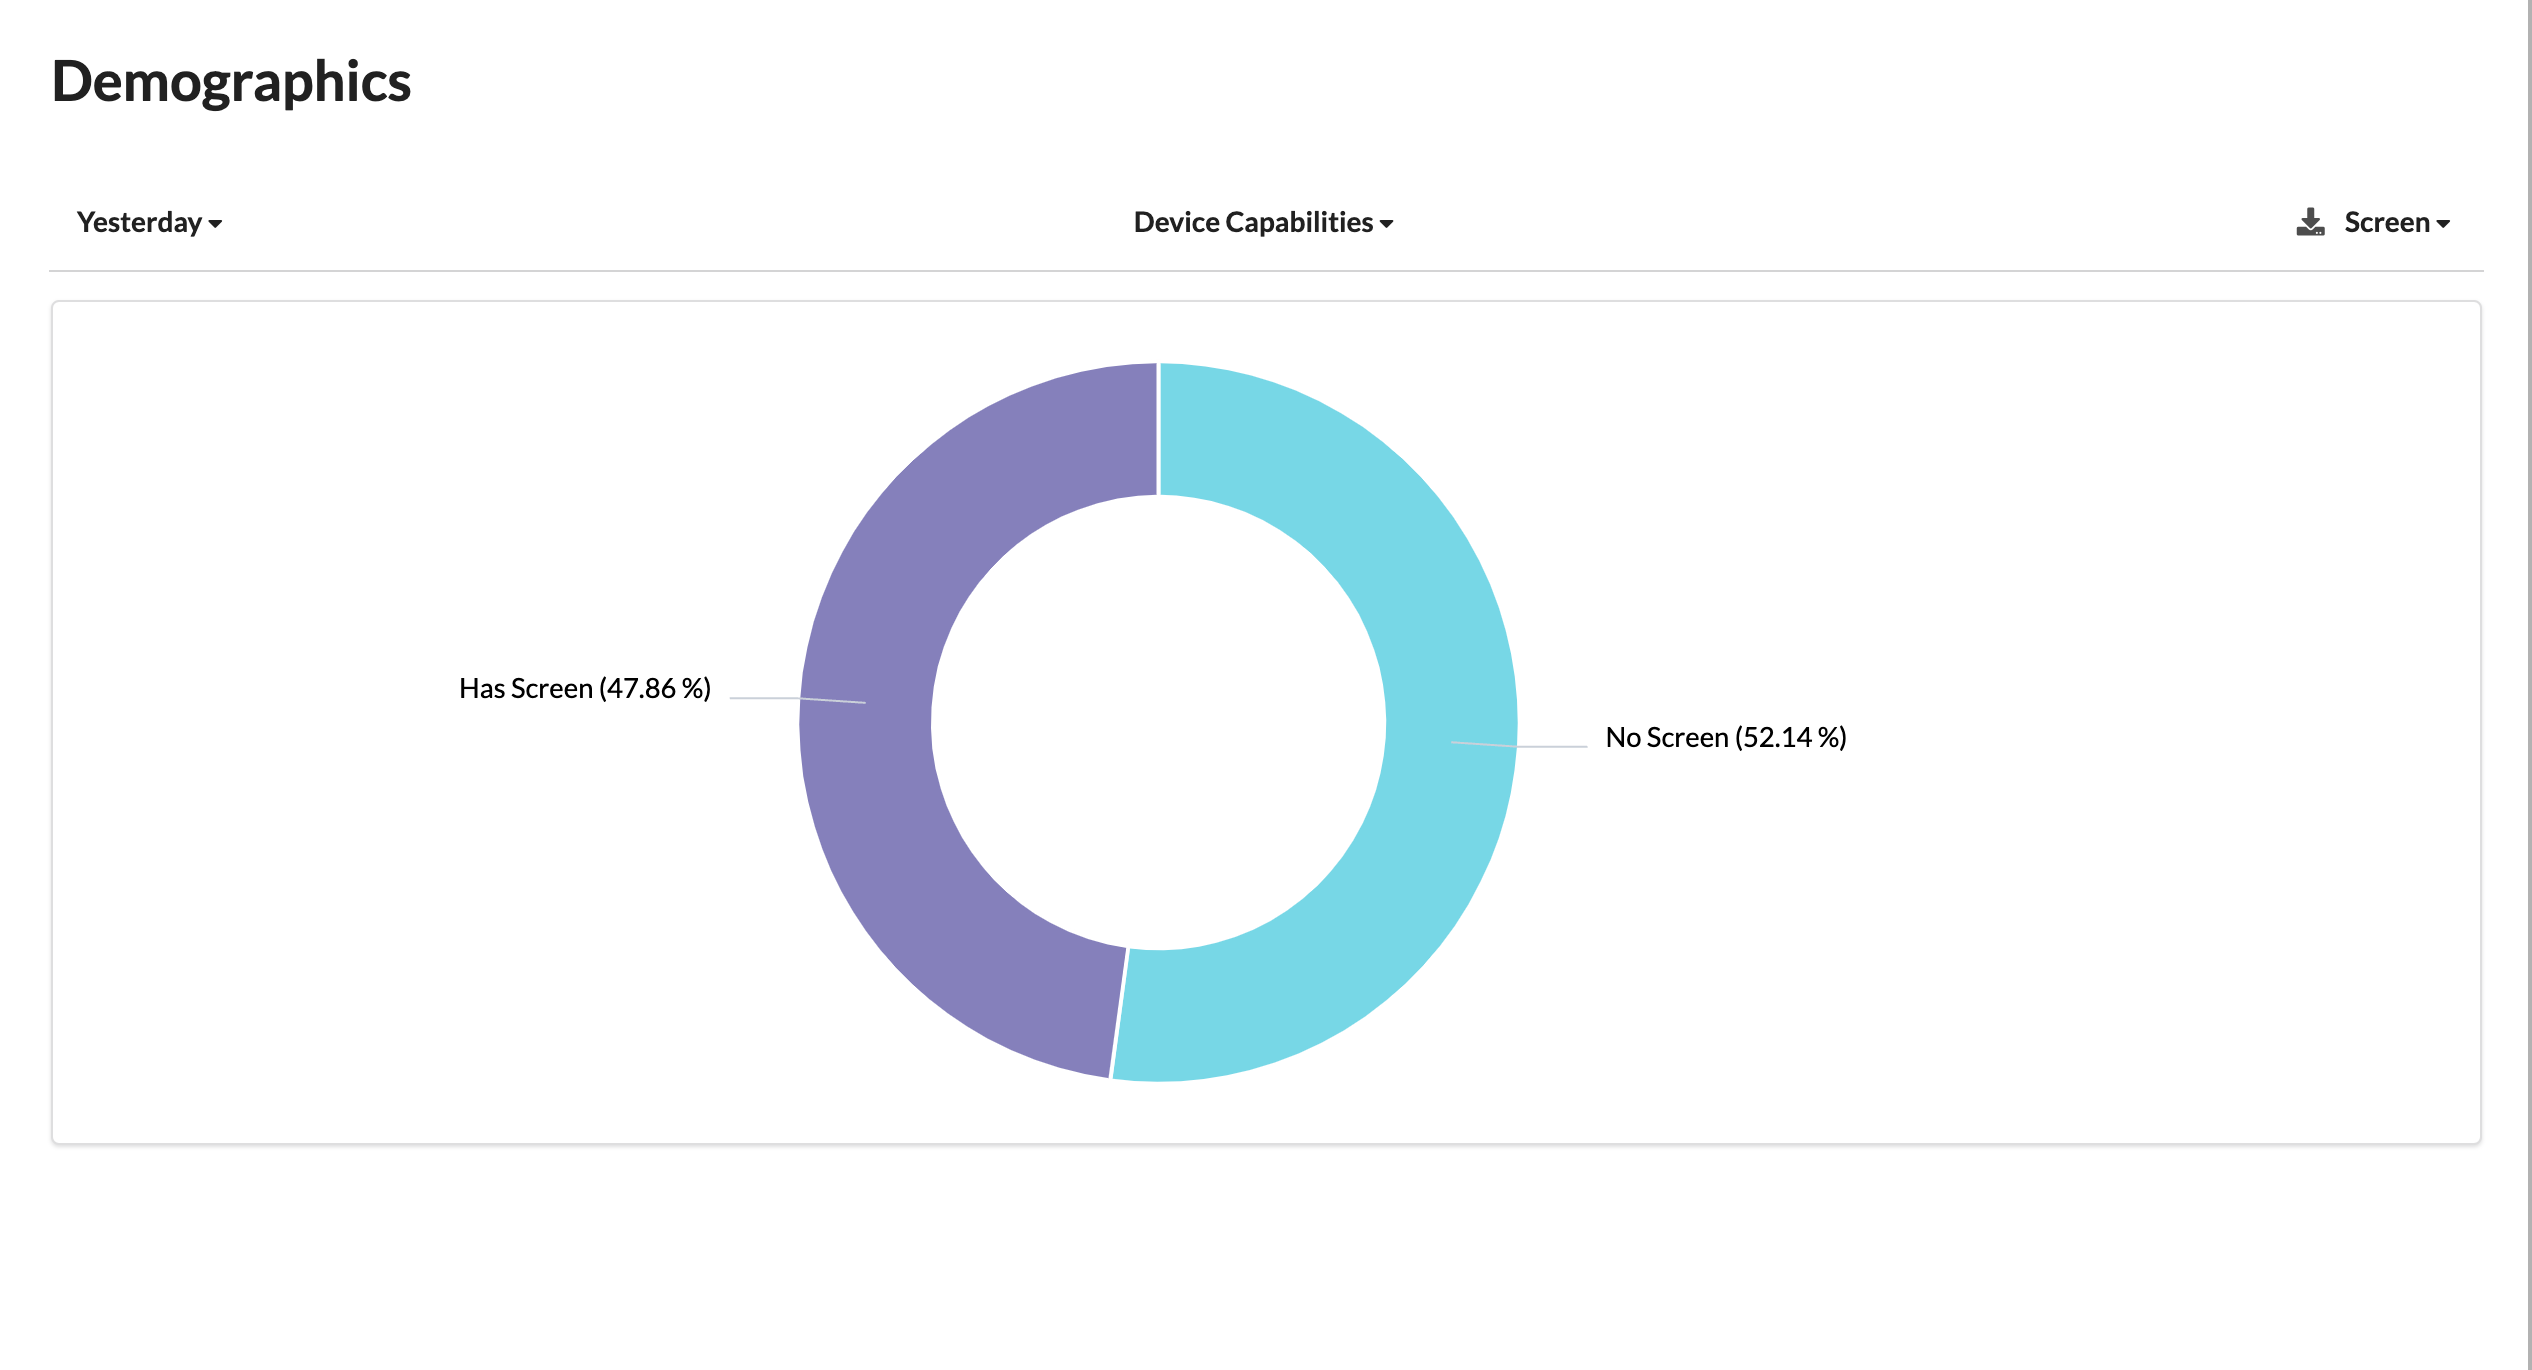
Each segment of the pie chart represents the percentage of users who possess the specified device capability within that category. For example, if you select the "Screen" category, you will see two percentages: one for users who have a screen and one for users who do not.
Usage and Interaction
Category Selection
Users can interact with the chart by selecting a specific category (e.g., Screen) to view the distribution of users with and without that capability within the selected category.
Percentage Display
When a category is selected, the chart displays percentages for two subcategories:
- Has [Capability]: This percentage represents the portion of users within the selected category who possess the specified capability (e.g., "Has Screen").
- No [Capability]: This percentage represents the portion of users within the selected category who do not possess the specified capability (e.g., "No Screen").
Significance and Usage
Device Capability Insights
The chart provides insights into the device capabilities of chatbot users and how they are distributed across different categories.
User Experience Customization
Chatbot developers can use this data to customize the user experience based on the available device capabilities. For example, if a user has a screen, the chatbot might provide visual content, whereas for users without a screen, it may focus on audio interactions.
Feature Prioritization
Businesses can prioritize the development of chatbot features based on the prevalence of specific device capabilities among users.
Content Adaptation
Understanding device capabilities helps in adapting content and responses to ensure a seamless and relevant user experience.
Challenges and Considerations
Data Accuracy
Ensure that the data on device capabilities is accurate and up-to-date to make informed decisions.
Privacy
Handle user device capability data with care, respecting user privacy and data protection regulations.
Segmentation
Consider how the data is segmented and whether additional categories or subcategories need to be included for a more detailed analysis.
Use Cases
User Experience Optimization
Developers can use this data to optimize the chatbot's user experience for different device capabilities.
Content Strategy
It informs decisions about the type of content and media formats to use in interactions.
Product Development
Businesses can use this information to guide the development of new features or platforms for the chatbot.
Accessibility
Ensuring that the chatbot is accessible to users with various device capabilities is an important consideration.
Summary
In summary, a Device Capabilities Circle Pie Chart for a chatbot displays the distribution of user device capabilities across different categories and allows users to explore the percentages of users with and without specific capabilities within each category. It's a valuable tool for understanding and optimizing the user experience based on device capabilities.