Demographics Gender Distribution
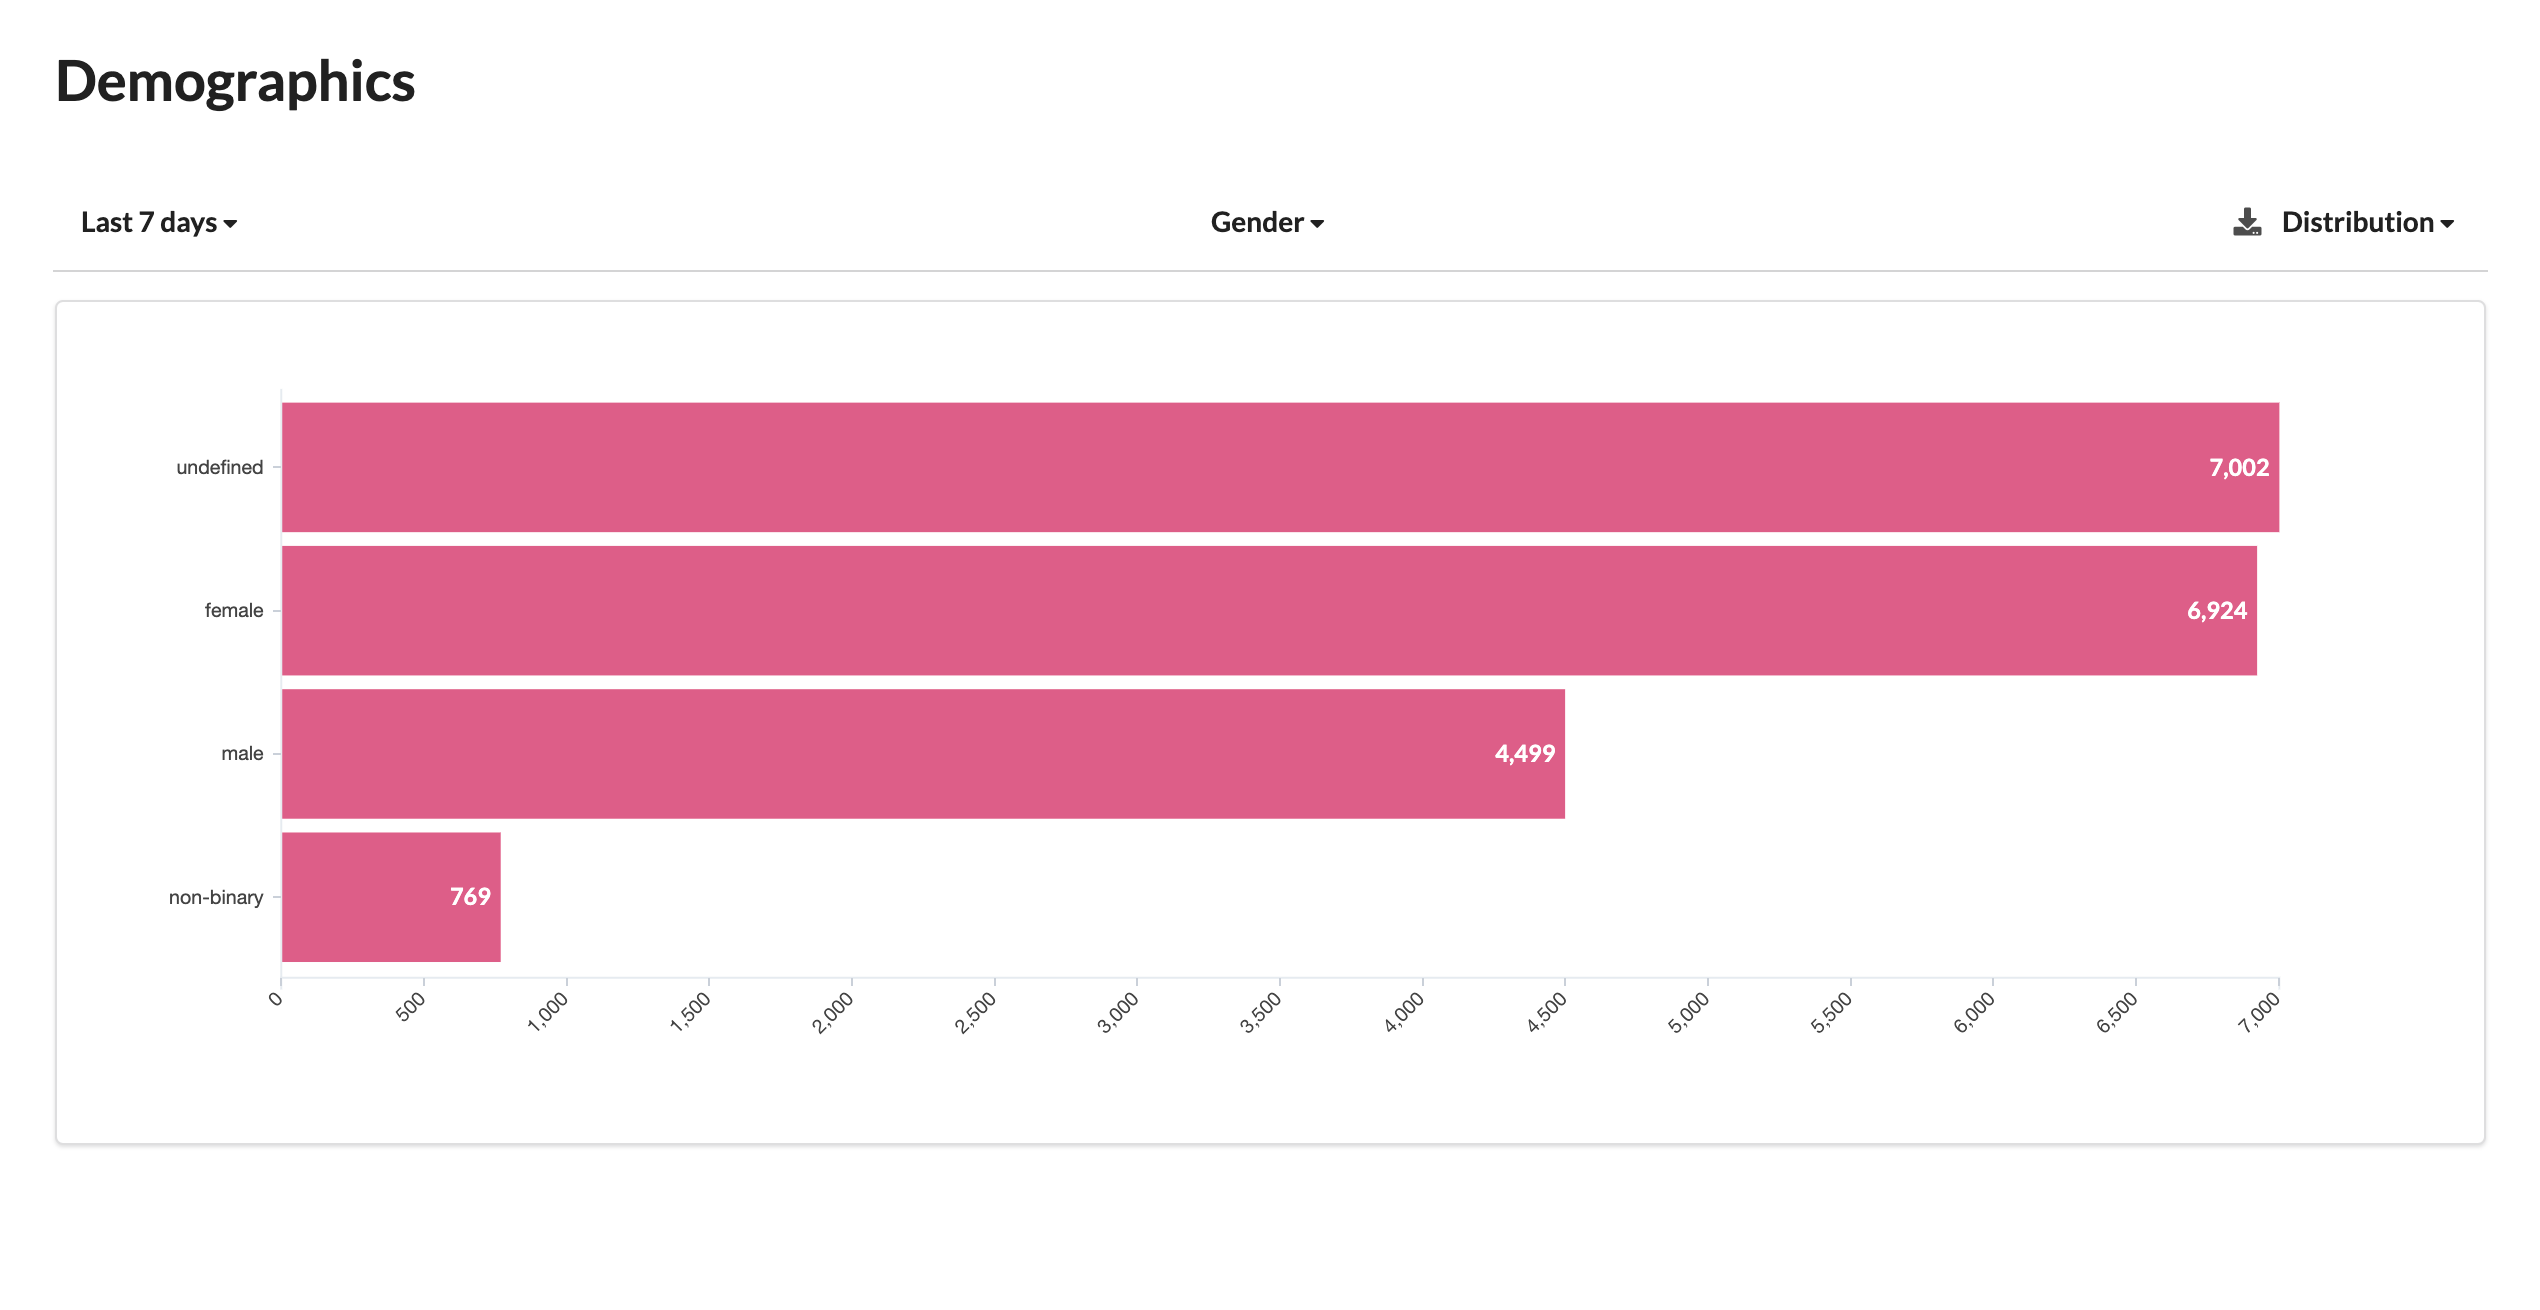
A Demographics Gender Distribution Horizontal Bar Graph is a visual representation that displays the distribution of users across different gender categories in a horizontal format. It provides a clear view of the gender makeup of your user base.
Here's an explanation of the key elements and significance of the graph:
Key Elements
Horizontal Bars
The graph consists of horizontal bars, with each bar representing a specific gender category.
Gender Labels
Beside each bar, there is typically a label or name representing the corresponding gender category.
Bar Length
The length of each bar corresponds to the number or percentage of users falling into that gender category. Longer bars represent a higher number or percentage of users.
Gender Categories
- Male: Users who identify as male.
- Female: Users who identify as female.
- Non-binary: Users who identify as non-binary, which is a gender identity that doesn't fit within the traditional categories of male or female.
- Undefined: Users whose gender identity is undefined or not specified.
Significance and Usage
Visual Comparison
The horizontal bar graph allows for a visual comparison of the gender distribution among your user base. You can quickly identify which gender categories are more prominent.
Gender Inclusivity
By including categories like "Non-binary" and "Undefined," you demonstrate inclusivity and respect for diverse gender identities among your users.
Audience Insights
Understanding the gender makeup of your user base can inform marketing and content strategies, ensuring that they resonate with your audience.
Inclusivity and Representation
Showing data on gender distribution helps in representing diverse user demographics accurately.
Challenges and Considerations
Data Collection
Ensure that you collect gender data in a respectful and inclusive manner, allowing users to self-identify their gender or choose "Undefined" if they prefer not to disclose.
Privacy and Sensitivity
Handle gender data with care, respecting user privacy and sensitivity around the topic.
Data Accuracy
Encourage users to provide accurate gender information without imposing binary choices, especially when offering options like "Non-binary" and "Undefined."
Use Cases
Audience Targeting
Marketers can use this data to tailor their campaigns to specific gender demographics.
Product Development
Understanding your user base's gender distribution can influence product features, user experience, and content.
Inclusivity
Demonstrating a commitment to inclusivity and diversity in your user base can have a positive impact on your brand image.
Summary
In summary, a Demographics Gender Distribution Horizontal Bar Graph displays the distribution of users across different gender categories, including traditional categories like male and female, as well as more inclusive categories like non-binary and undefined. It provides valuable insights for audience targeting, product development, and demonstrating inclusivity.