Demographics Location Top Twenty Distribution
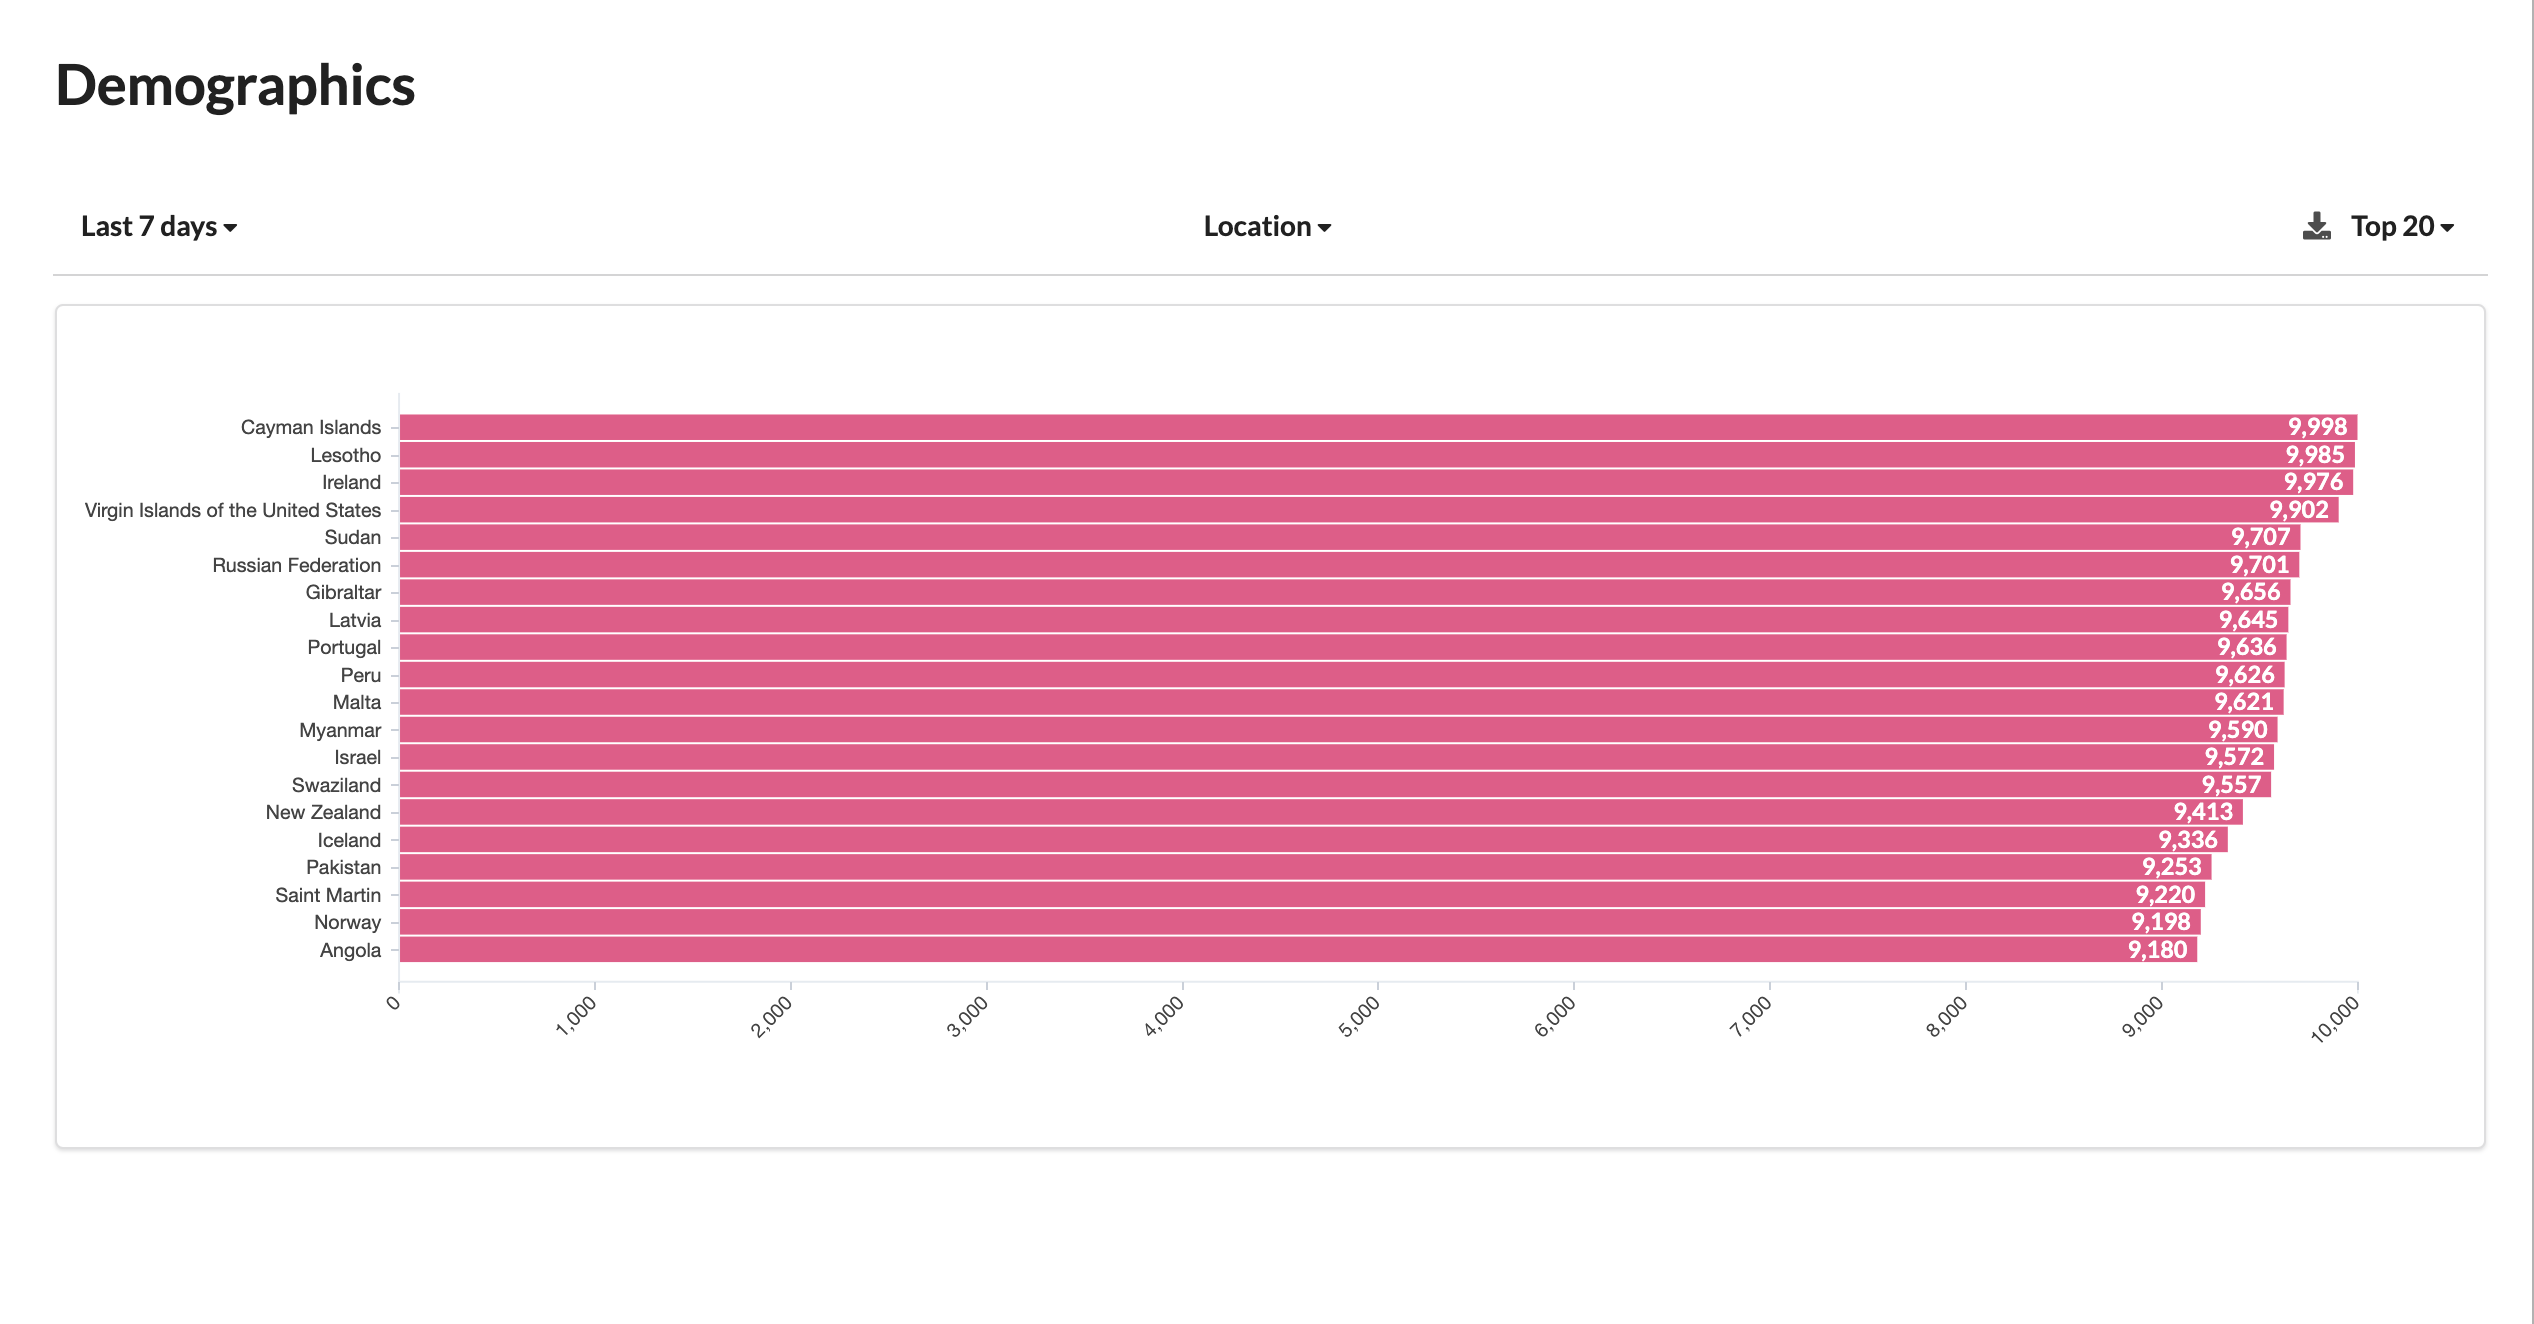
A Demographics Top Twenty Location Horizontal Distribution Graph for a chatbot is a visual representation that displays the geographical distribution of users based on their locations in a horizontal format. This specific graph focuses on the top twenty locations with the highest user counts or percentages. It provides a concise view of where the most users are located, allowing for quick identification of prominent regions.
Here's an explanation of the key elements and significance of this type of graph:
Key Elements
Horizontal Bars
The graph consists of horizontal bars, with each bar representing one of the top twenty locations with the highest user counts or percentages.
Location Labels
Beside each bar, there are labels representing the corresponding locations. These labels typically include the names of cities, states, or countries, depending on the level of granularity.
Bar Length
The length of each bar corresponds to the number or percentage of users in that specific location. Longer bars represent locations with a higher number or percentage of users.
Significance and Usage
Quick Overview
The horizontal format of the graph provides a rapid visual overview of the top twenty locations where the chatbot's users are concentrated.
Regional Focus
It helps in identifying regions that are particularly significant in terms of user engagement or activity.
Targeted Campaigns
Marketers can use this data to plan targeted marketing campaigns or promotions in regions with high user presence.
Localization
Understanding user locations can inform decisions about localization efforts, such as translating content or adapting the chatbot's responses to specific regions or languages.
Challenges and Considerations
Data Accuracy
Ensure that location data is accurate and up-to-date. Inaccurate or outdated location information can skew the results.
Privacy
Handle location data with care, considering user privacy and data protection regulations.
Granularity
Choose an appropriate level of geographical granularity based on your objectives. For example, you can focus on cities, states, or countries, depending on what's most relevant for your chatbot.
Use Cases
Regional Targeting
Marketing teams can use this data to target specific regions with tailored campaigns or content.
Product Localization
Understanding user locations helps in localizing products and services.
Resource Allocation
Businesses can allocate resources and support efforts to regions with a high concentration of users.
User Engagement
It helps in personalizing user engagement strategies based on regional preferences and trends.
Summary
In summary, a Demographics Top Twenty Location Horizontal Distribution Graph for a chatbot provides a concise view of the geographical distribution of users in the top twenty locations with the highest user counts or percentages. It's a valuable tool for regional targeting, localization, and resource allocation decisions.