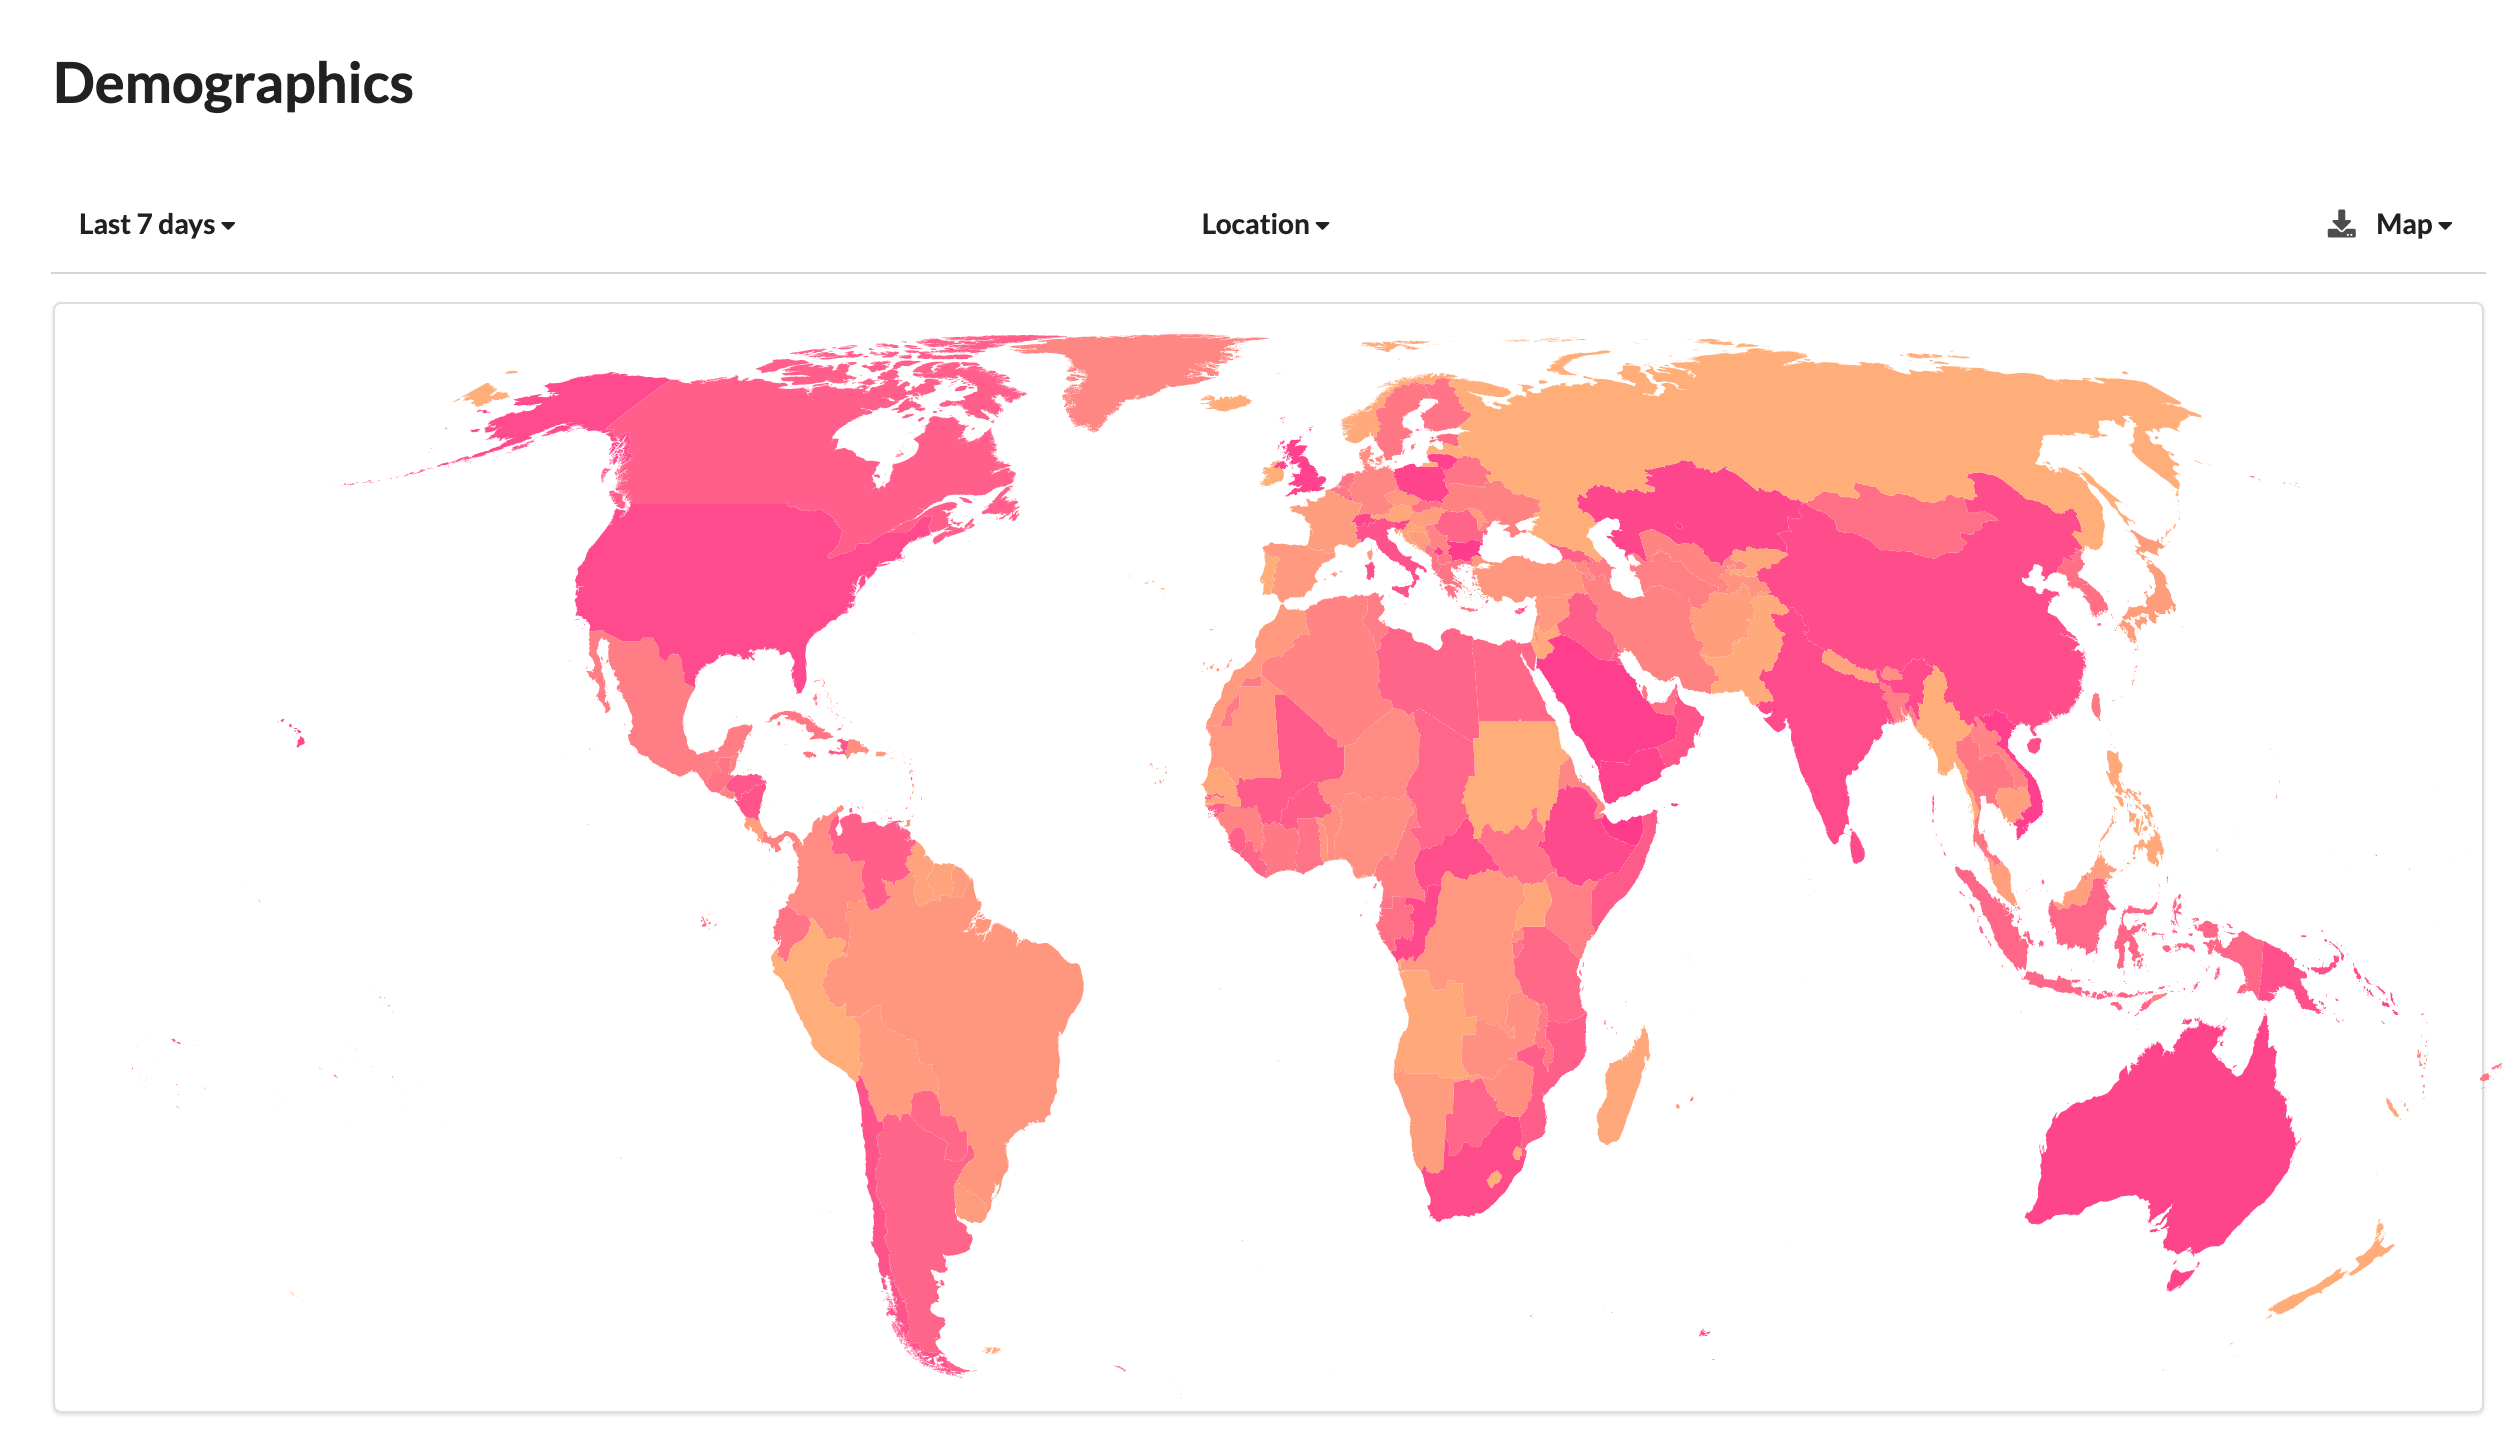
Demographics Location Choropleth Graph
A Demographics Location Choropleth Graph for a chatbot is a visual representation that utilizes a choropleth map to display the geographical distribution of users based on their location. This visualization is invaluable for understanding where your chatbot's users are located geographically and can provide insights into user demographics.

Key Elements
Choropleth Map
The primary component of the graph is a map where geographic regions are shaded or colored based on the density or count of users in each region. These regions can vary in size and can represent countries, states, provinces, cities, or any other geographical unit depending on the level of granularity desired.
Color Scale
A color scale is employed to represent user density or counts on the map. Typically, darker or brighter colors indicate higher user density, while lighter colors signify lower density.
Region Labels
Beside or within each region on the map, there may be labels indicating the name of the region and possibly the user count or percentage to provide additional context.
Significance and Usage
Geographic Insights
The choropleth graph offers a visual overview of the geographical distribution of your chatbot's users, enabling you to identify regions of high and low user activity.
Targeted Campaigns
Businesses can utilize this data to plan targeted marketing campaigns or promotions in regions with a high concentration of users, maximizing the effectiveness of their marketing efforts.
Localization
Understanding user locations can inform decisions about localization efforts, such as translating content or adapting the chatbot's responses to specific regions or languages, thereby enhancing user experience and engagement.
Expansion Opportunities
The graph can help identify regions where there is potential for user growth and expansion, guiding business decisions regarding market expansion strategies.
Geographical Discrepancies
It can also highlight any geographical discrepancies or anomalies in user distribution that may require further investigation or adjustments in marketing strategies.
Challenges and Considerations
Data Accuracy
Ensuring that location data is accurate and up-to-date is crucial. Inaccurate or outdated location information can lead to misleading insights and decisions.
Privacy
Handling location data with care is essential, and businesses must adhere to user privacy and data protection regulations when collecting and analyzing such data.
Granularity
Choosing an appropriate level of geographical granularity based on specific objectives is important. This can involve focusing on countries, states, or even more localized regions depending on the intended analysis.
Use Cases
Marketing Strategy
Marketing teams can leverage this data to target specific regions with tailored campaigns, increasing the effectiveness of their marketing efforts and improving ROI.
Product Localization
Understanding user locations helps in localizing products and services, ensuring that offerings resonate with users in different geographic regions.
User Support
It can inform decisions about providing regional customer support or tailoring content to address the specific needs and preferences of users in different locations.
Business Expansion
For businesses considering expansion into new markets, this data can provide valuable insights into where to establish a physical presence or focus their expansion efforts.
User Engagement
By personalizing user engagement strategies based on regional preferences and trends, businesses can enhance user satisfaction and drive higher levels of engagement with their chatbot.
Summary
In summary, a Demographics Location Choropleth Graph for a chatbot provides a geographical overview of user distribution, empowering businesses to make informed decisions about marketing, localization, and user engagement strategies. It serves as a valuable tool for understanding user demographics based on location and optimizing business operations accordingly.