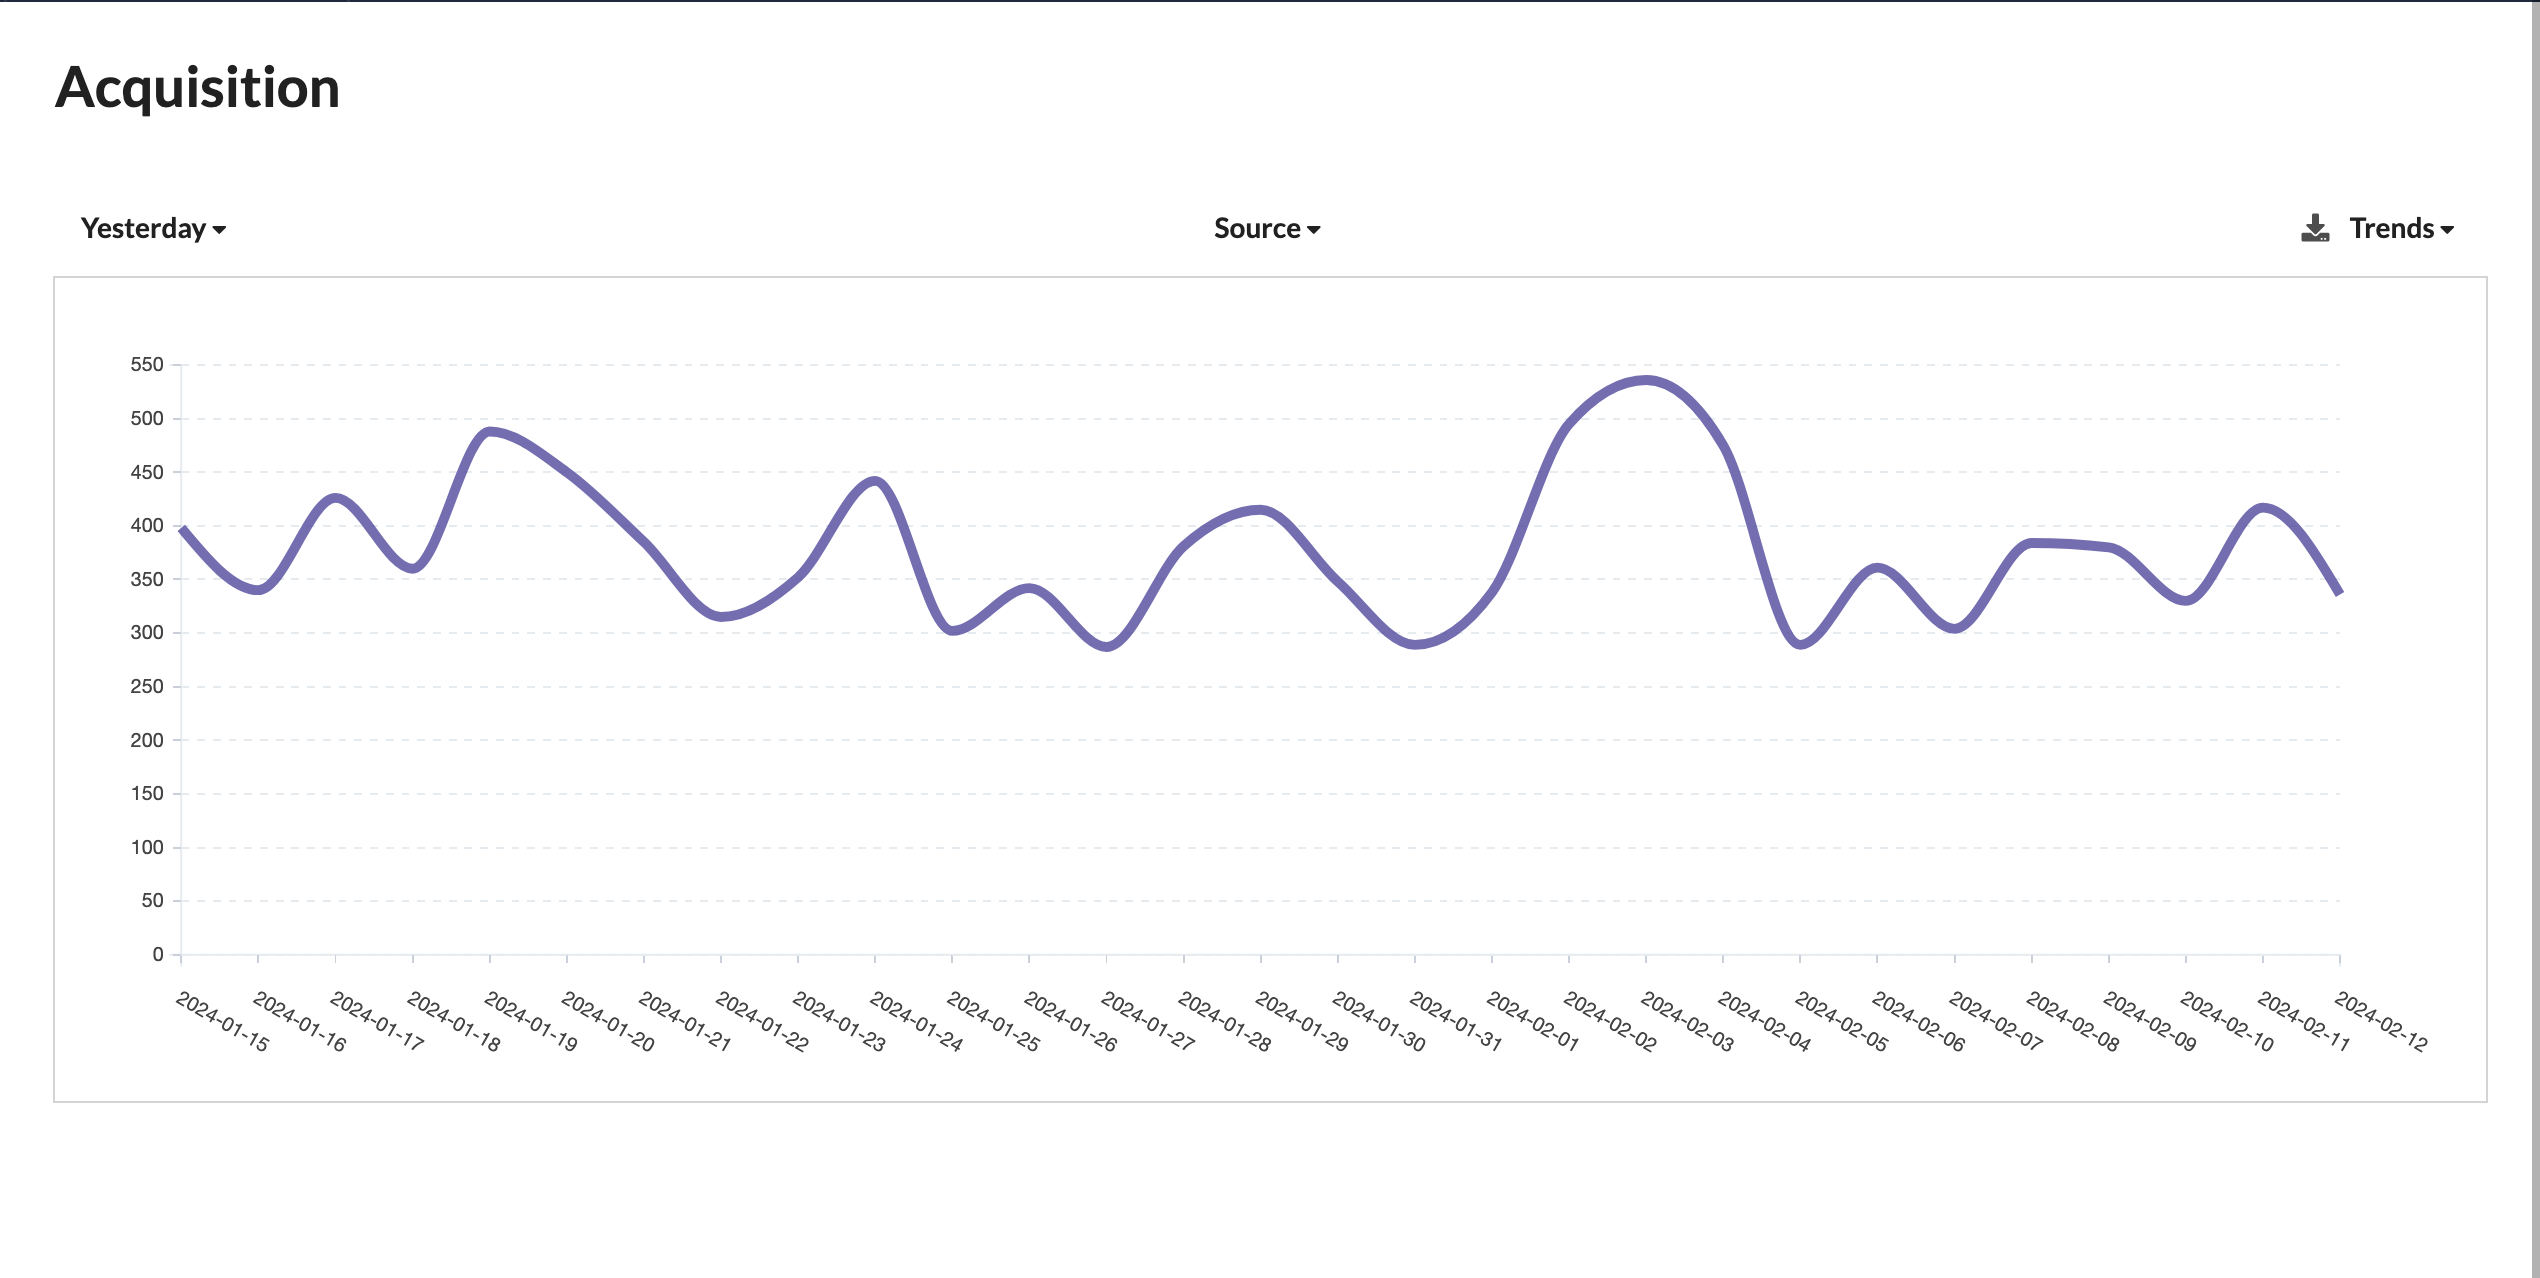
Acquisition Source Trends
An Acquisition Source Trends Graph for a chatbot is a visual representation that displays changes and patterns in the effectiveness of various user acquisition sources or channels over time. It provides insights into how different sources have performed in attracting and introducing users to the chatbot.
Key Elements
Time Period
The x-axis represents time, typically divided into specific intervals such as weeks, months, or quarters. Each data point on the x-axis corresponds to a specific time period.
User Counts or Percentages
The y-axis represents the number or percentage of users acquired through different sources during each time period.
Multiple Lines or Bars
The graph consists of multiple lines or bars, each representing a different acquisition source or channel. Each line or bar displays how many users were acquired through that source during each time period.
Significance and Usage
Trend Identification
The graph helps identify trends and patterns in user acquisition through various sources, highlighting whether certain sources have become more or less effective over time.
Source Performance Assessment
Visual comparison of the lines or bars representing different sources enables assessment of which sources have consistently performed well and which might require adjustments.
Seasonality Analysis
The graph reveals seasonality in source effectiveness, indicating whether some sources perform better during specific times of the year.
Resource Allocation
Insights from the graph inform allocation of marketing resources and budget to sources that are most effective, ensuring optimal return on investment (ROI).
Source Optimization
By analyzing the distribution, marketers make data-driven decisions to optimize underperforming sources and replicate the success of high-performing ones.
Challenges and Considerations
Data Accuracy
Ensuring data tracking mechanisms accurately attribute users to the correct acquisition sources or channels is crucial.
Source Naming
Clear and consistent source labels prevent confusion when interpreting the graph.
Interpreting Trends
Accurate interpretation of trends is essential. Declining trends may warrant investigation and adjustment, while rising trends may indicate success.
Use Cases
Marketing Strategy Optimization
Acquisition Source Trends Graphs refine and adjust marketing strategies based on changing user acquisition patterns.
Source Assessment
Businesses analyze how specific user acquisition sources or channels impact acquisition trends displayed in the graph.
Resource Allocation
Decisions about resource allocation and budget for user acquisition are informed by the data, ensuring optimal ROI for different sources.
Adaptation to User Behavior
Understanding changes in user preferences for different sources allows companies to adapt strategies to align with user behavior.
In summary, an Acquisition Source Trends Graph provides historical data on how different user acquisition sources or channels have performed over time, enabling businesses to adapt and optimize marketing strategies based on evolving source trends.