Power Users Curve in Chatbots
A "Power Users Curve" for a chatbot is a graphical representation illustrating the distribution of user activity levels within the chatbot's user base. It provides valuable insights into user engagement dynamics and helps identify highly engaged users or "Power users."
Here's how to interpret and understand a Power Users Curve for a chatbot:
Elements of a Power Users Curve
-
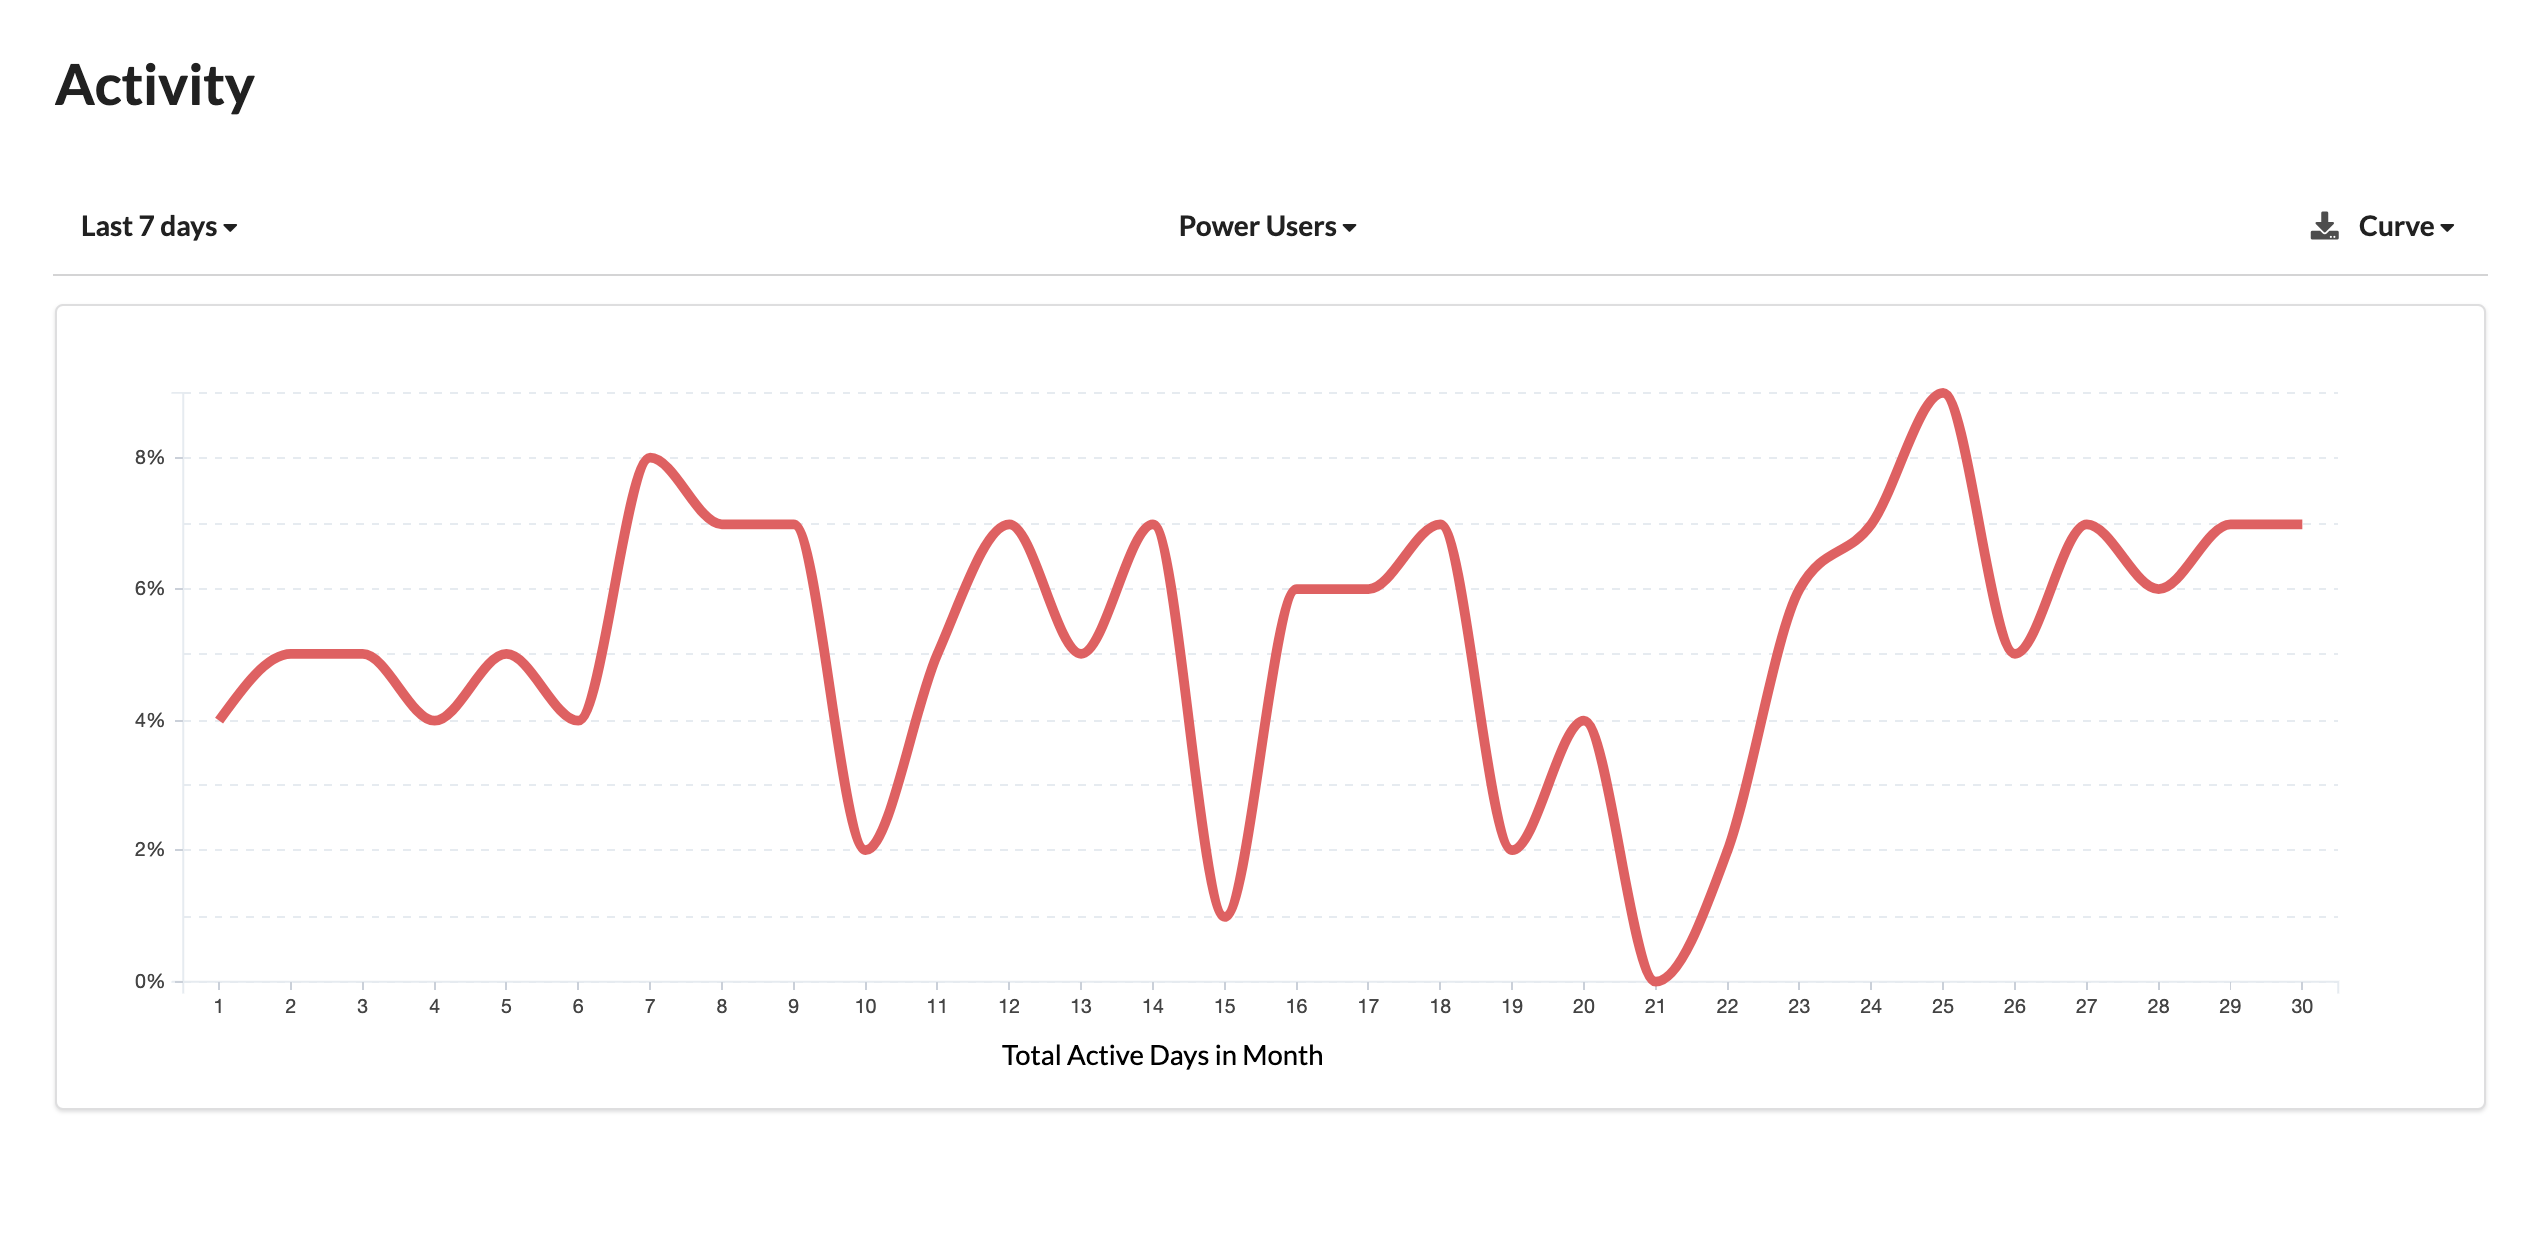
X-Axis: Represents user activity levels or engagement metrics, ranging from low to high engagement levels.
-
Y-Axis: Indicates the cumulative percentage of users falling below a certain activity level on the x-axis, from 0% to 100%.
-
Curve: Illustrates how user activity is distributed across the user base, showing the percentage of users with engagement levels at or below a given threshold.
Interpretation of a Power Users Curve
-
Distribution of User Engagement: Provides insights into how user engagement is distributed within the chatbot's user base.
-
Identification of Power Users: Power users, the most engaged users, are represented at the right end of the curve. A steeper curve at this end indicates a higher concentration of power users.
-
Long Tail Distribution: The curve often exhibits a long tail, indicating that a majority of users have lower engagement levels, while a smaller percentage are highly engaged.
-
Focus on Power Users: Enables targeted engagement strategies, loyalty programs, or special offers for power users.
-
Segmentation: Allows segmentation of users based on engagement levels, facilitating tailored strategies for different user segments.
-
Retention Strategies: Helps in crafting retention strategies, focusing efforts on retaining power users to maintain high engagement levels.
-
Benchmarking: Enables tracking changes in user engagement over time and assessing the effectiveness of chatbot updates or marketing campaigns.
Use Cases for a Power Users Curve
-
Personalization: Facilitates personalized interactions and content recommendations for power users.
-
Retention Strategies: Identifies opportunities to develop targeted retention strategies for retaining power users.
-
Content Recommendations: Tailors content recommendations and product suggestions based on engagement patterns.
-
User Onboarding: Guides improvements in onboarding processes to increase engagement for users with lower activity levels.
-
Marketing Campaigns: Enables more cost-effective targeting of power users in marketing campaigns.
Summary
In summary, a Power Users Curve for a chatbot provides insights into user engagement distribution, identifies power users, and informs tailored engagement strategies. This visualization is essential for retaining valuable users, providing personalized experiences, and optimizing chatbot performance.