New Users
A "New Users" line graph for a chatbot, where the Y-axis represents the number of new users, and the X-axis indicates weekdays starting from Monday, January 1st, and ending on Sunday, January 7th, provides insights into user acquisition trends over the past week.
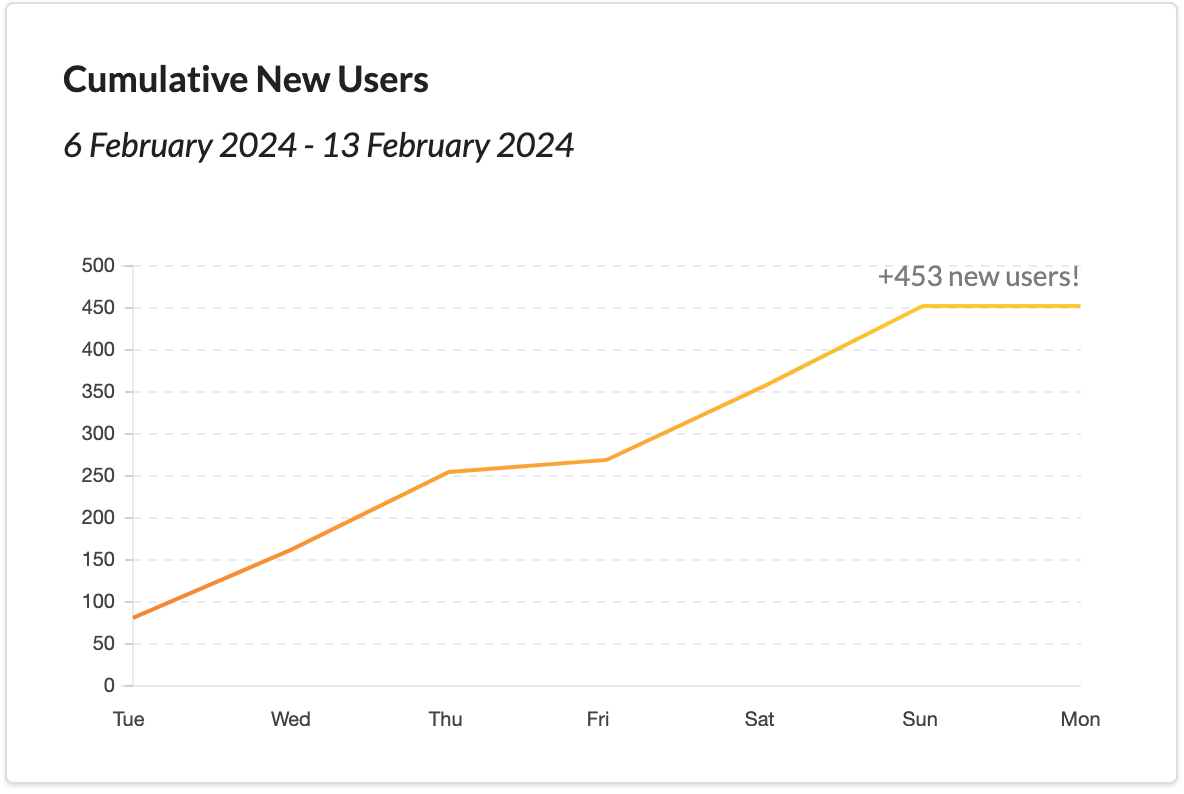
Y-Axis (Number of Users)
The Y-axis represents the number of new users who have engaged with the chatbot during the specified time frame. Each data point on the Y-axis represents the count of new users.
X-Axis (Weekdays)
The X-axis displays the weekdays over the past week, starting from Monday, January 1st, and progressing through Tuesday, Wednesday, Thursday, Friday, Saturday, and ending on Sunday, January 7th. Each day corresponds to a data point on the graph.
Line Graph
The data points on the graph are connected by a line, creating a line graph. Each point on the line indicates the number of new users acquired on a specific day of the past week.
Significance and Use Cases
Weekly User Acquisition Trends
The graph allows you to visualize and analyze the daily trends in new user acquisition over the past week. It helps you understand which days saw higher or lower user sign-ups.
Campaign Impact Assessment
You can assess the effectiveness of any marketing campaigns, promotions, or user acquisition strategies that were implemented during this week. Look for spikes or variations in user acquisition around campaign launch dates.
Performance Evaluation
Monitoring new user acquisition helps evaluate the chatbot's performance in attracting and onboarding new users. Sudden drops or surges may indicate issues or successes.
Resource Allocation
Based on the trends observed, you can make informed decisions about allocating resources for marketing efforts, user engagement, or support during specific days of the week.
Historical Data Comparison
You can compare the current week's data with data from previous weeks to identify patterns, seasonal variations, or deviations in user acquisition.
User Engagement Strategies
If you notice fluctuations in new user acquisition, consider adjusting your user engagement strategies or onboarding processes accordingly.
Data-Driven Decision-making
The graph provides actionable data for making informed decisions related to user acquisition and chatbot performance improvement.
Summary
In summary, a "New Users" line graph for a chatbot, focusing on the past week's data, helps chatbot developers, marketers, and administrators gain insights into user acquisition trends. This information guides decision-making processes related to resource allocation, user engagement, and marketing efforts.