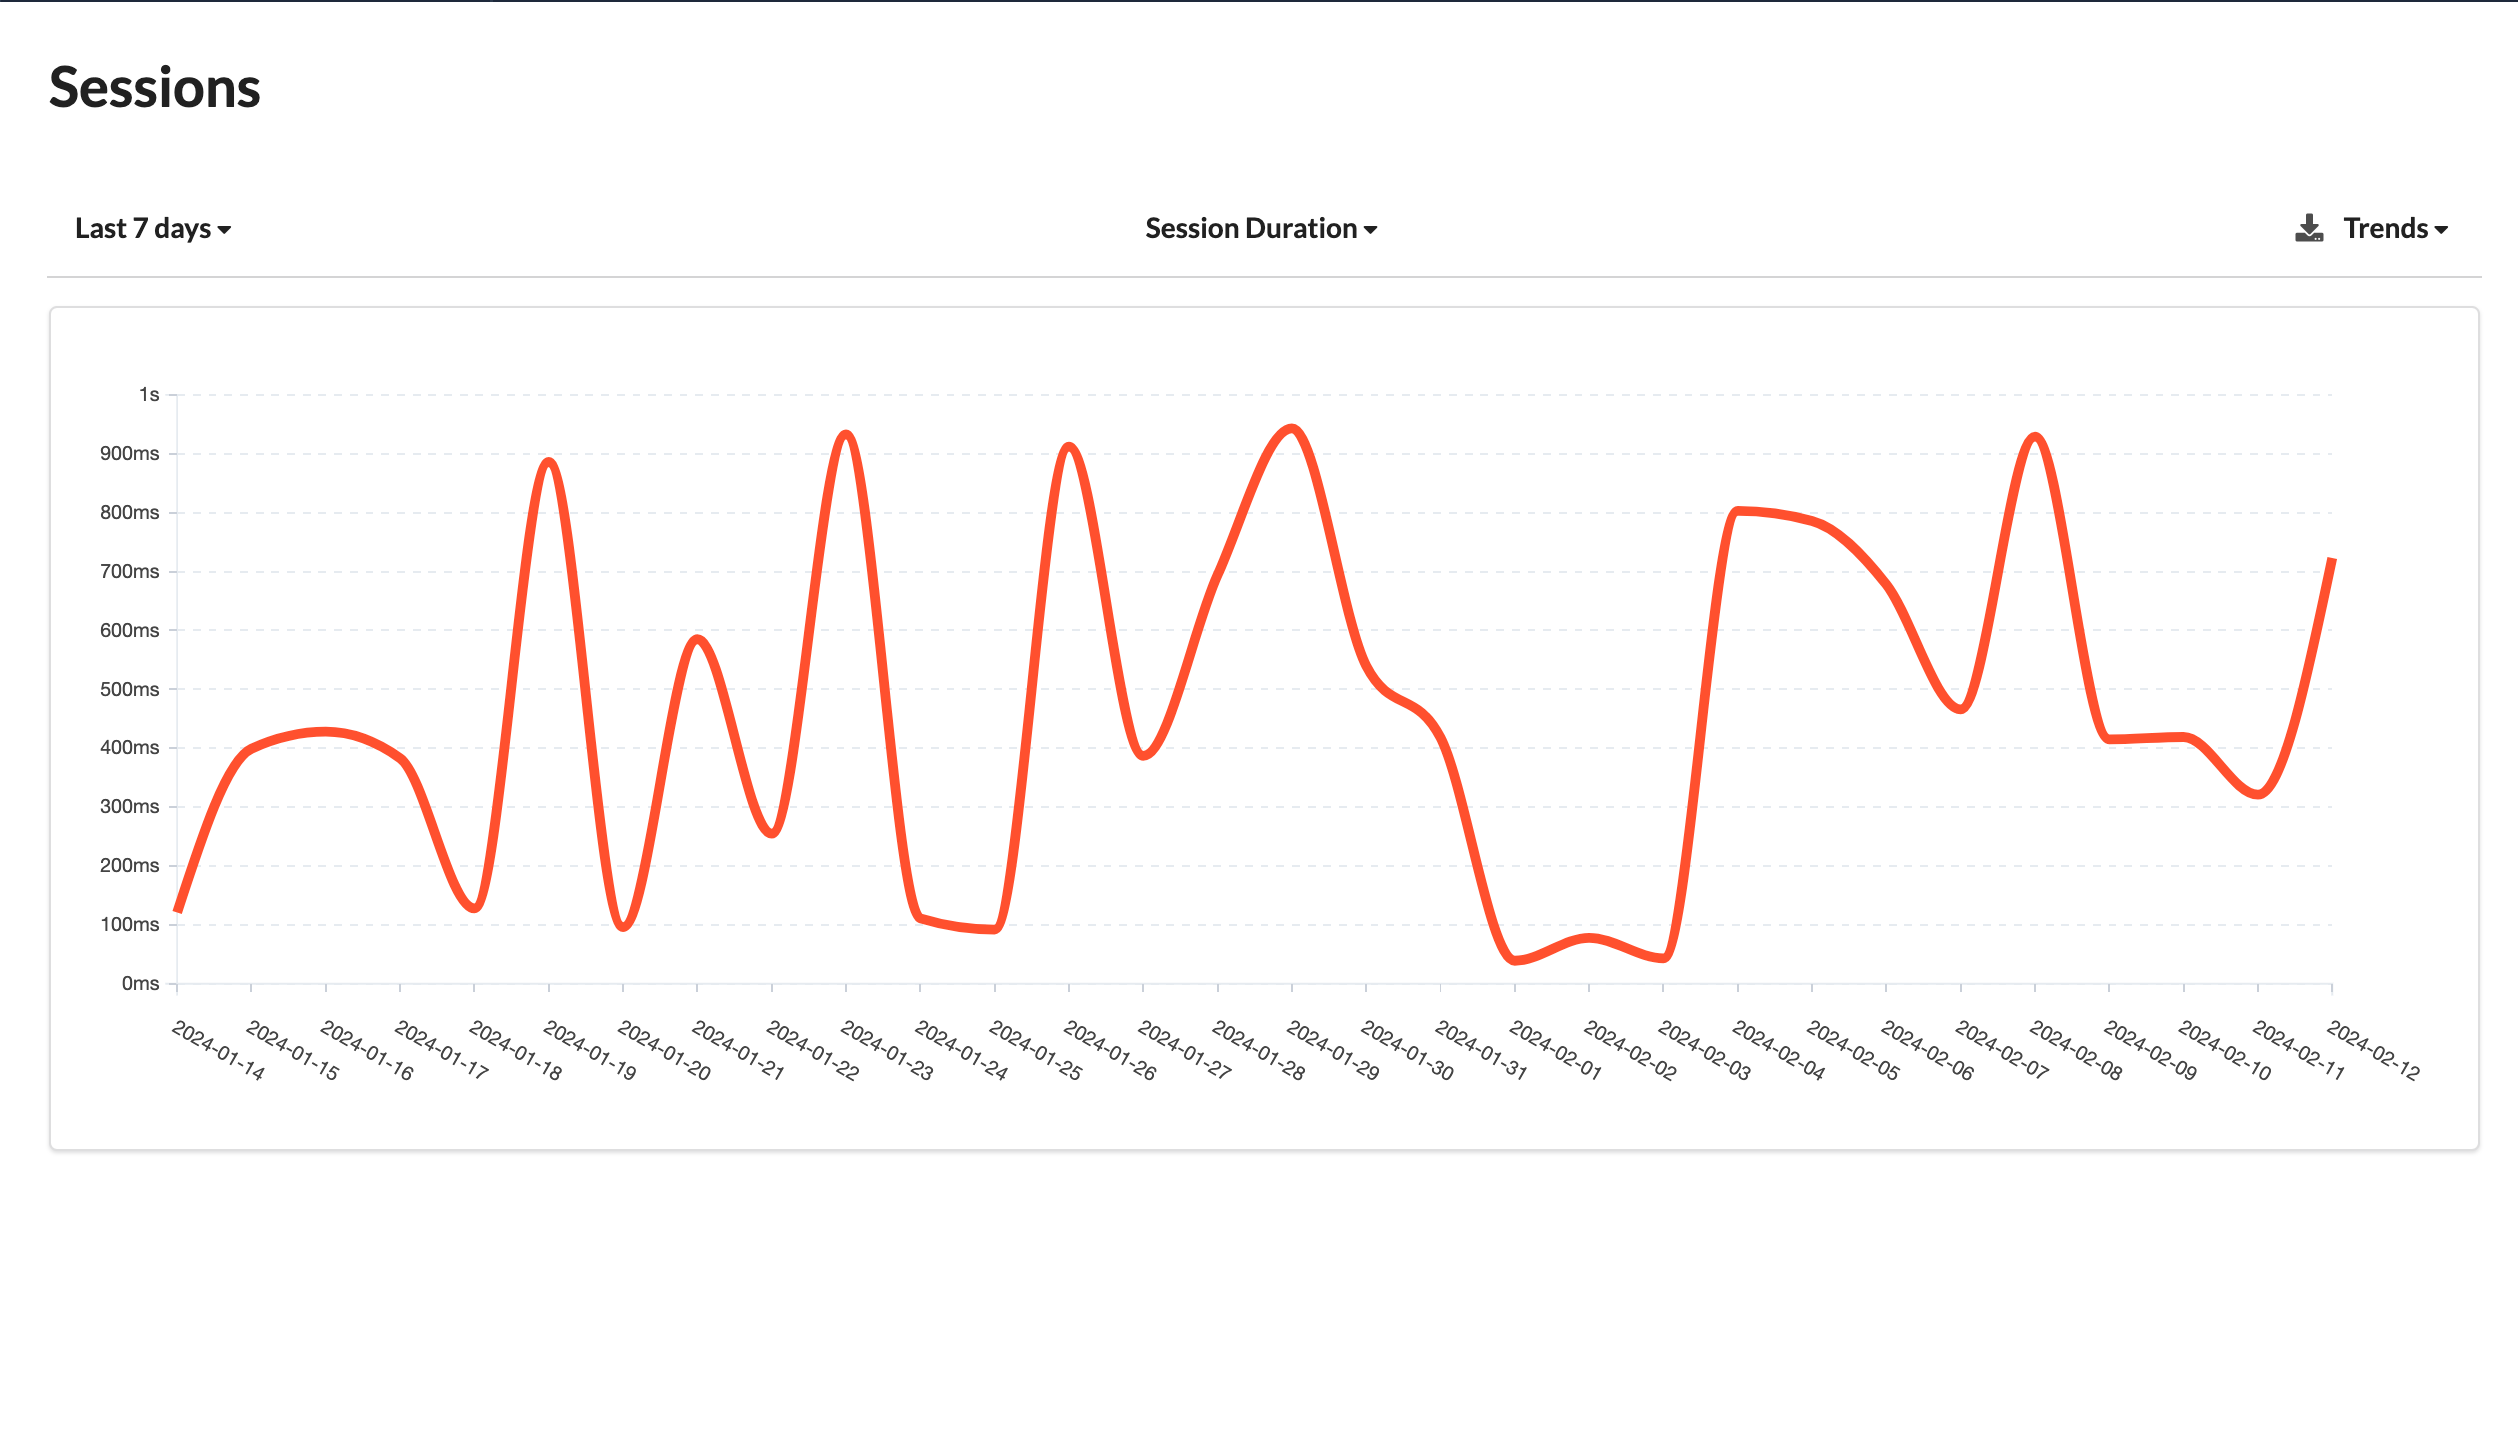
Session Duration Trends
A Session Duration Trends graph for a chatbot tracks and displays changes in the durations of user sessions with the chatbot over a specified period. This graph aids chatbot developers, operators, and analysts in monitoring and analyzing evolving user interaction patterns and session length trends.
Here's how to interpret and understand a Session Duration Trends graph for a chatbot:
X-Axis (Time Period)
The x-axis represents a specific time period, such as days, weeks, or months, depending on the data's granularity. It indicates when the user sessions occurred or were recorded.
Y-Axis (Session Duration)
The y-axis denotes the duration of user sessions within the corresponding time period, measuring the average or total session duration for that timeframe. The unit of measurement (e.g., seconds, minutes) is specified on the axis.
Data Points
Each data point on the graph reflects the average or total session duration for user sessions during a particular time period. This data is typically collected and aggregated over time.
Trend Line
In a line graph, the trend line connects the data points, visually representing how session durations change over the specified time frame. An upward trend indicates increasing session durations, while a downward trend suggests decreasing durations.
Interpreting a Session Duration Trends Graph for a Chatbot
Direction of Trend
The overall direction of the trend line is crucial. An upward trend in session duration suggests increasing user engagement with the chatbot, while a downward trend may signify decreasing engagement.
Periodic Patterns
Observing seasonal or recurring patterns in session duration trends can provide valuable insights. For instance, weekly or monthly peaks may correlate with specific events or user behaviors.
Anomalies
Sudden spikes or drops in session duration can indicate unusual user behavior or chatbot performance issues, warranting further investigation.
Correlation with Changes
Correlating trends with specific changes in the chatbot, such as updates to content or features, helps derive meaningful insights. Significant changes in session duration trends post-update can offer valuable feedback.
User Engagement
Understanding session duration trends aids in gauging user engagement. Longer sessions typically indicate that users find value in the chatbot and are more engaged in conversations.
Opportunities for Improvement
Analyzing trends over time facilitates identifying areas for improvement, such as optimizing responses, enhancing user guidance, or addressing usability issues.
Use Cases for Session Duration Trends Analysis
Performance Evaluation
Monitoring session duration trends assists in evaluating the chatbot's effectiveness and performance in retaining user engagement.
Content Optimization
Trends analysis guides efforts to optimize chatbot content, ensuring efficient delivery of valuable information.
User Experience Enhancement
Insights from session duration trends drive enhancements in the chatbot's user experience, making it more engaging and user-friendly.
A/B Testing
Session duration trends serve as a key metric for evaluating different versions of the chatbot in A/B testing scenarios, determining which version performs better in terms of user engagement.
Feedback Loop
Incorporating session duration trends into the feedback loop facilitates continuous improvement of the chatbot's design and functionality.
Summary
In summary, a Session Duration Trends graph for a chatbot visually illustrates how user interaction patterns evolve over time. It offers valuable insights into user engagement and the chatbot's performance, guiding developers and operators in optimizing the chatbot's design and content to enhance the user experience.