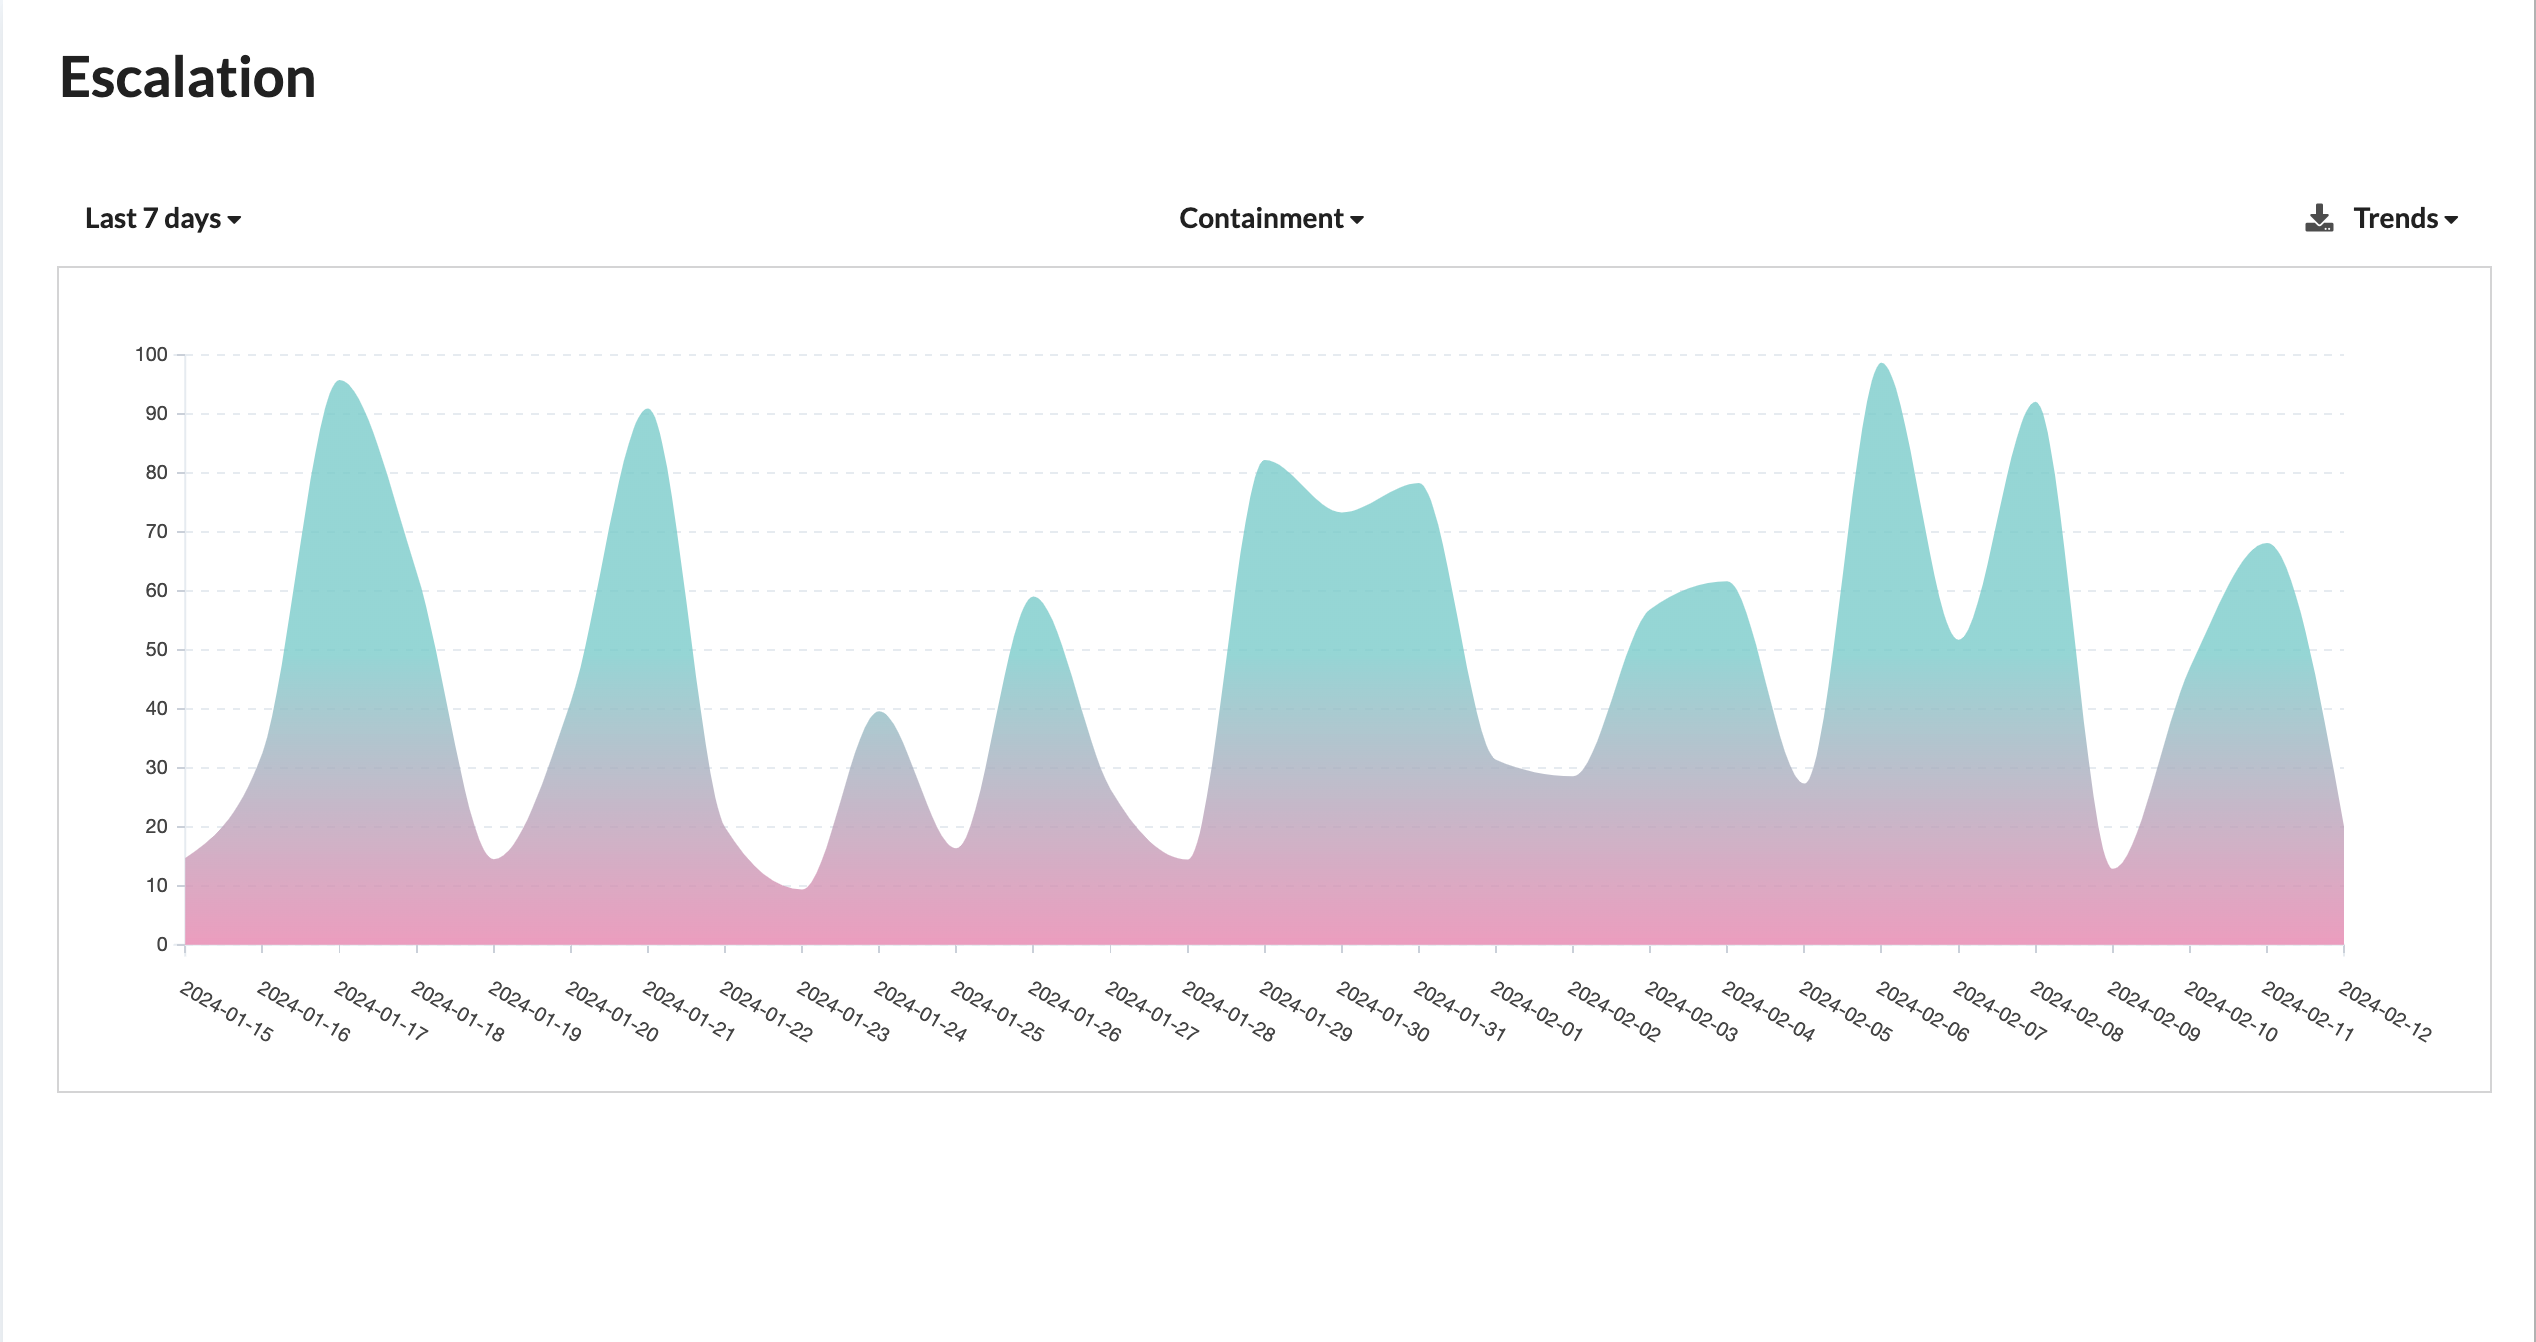
Containment Rate Graph for Chatbots
A Containment Rate graph for a chatbot is a visual representation that tracks and displays the effectiveness of a chatbot in containing user interactions within the chatbot itself without the need for escalation to human agents or additional support channels. The containment rate measures the percentage of user queries or issues that the chatbot successfully handles without requiring escalation.
Key Elements and Significance
Containment Rate Metric
The primary metric represented in this graph is the "containment rate," which is the percentage of user interactions or conversations that the chatbot successfully resolves without needing to escalate to a human agent or external support system.
Time Period
The graph may cover a specific time period, such as daily, weekly, or monthly, depending on the organization's monitoring and reporting needs.
Escalation and Containment Criteria
Organizations typically define criteria or thresholds that determine when an interaction should be escalated or when it can be contained by the chatbot. These criteria may include factors such as user intent, complexity of the query, and the chatbot's confidence in its response.
Escalation Categories
The Containment Rate graph may categorize escalations into different types or reasons. For example, it can distinguish between escalations due to user requests for human assistance and those triggered by specific failure scenarios.
Trends and Patterns
By analyzing the Containment Rate graph over time, organizations can identify trends and patterns. It allows them to assess whether the chatbot's containment capabilities are improving or if there are specific areas where containment rates drop.
Optimization Insights
Insights from the graph can guide efforts to optimize chatbot performance and increase containment rates. Organizations can focus on improving chatbot training, understanding user intent, and refining responses.
User Satisfaction
High containment rates typically correlate with better user satisfaction since users can get their queries resolved efficiently within the chatbot interface.
Resource Allocation
Monitoring containment rates is also important for resource allocation decisions. High containment rates may reduce the need for a large team of human agents, which can lead to cost savings.
Use Cases for Containment Rate Analysis
Chatbot Improvement
Organizations can use the containment rate data to identify areas where the chatbot's performance can be enhanced, increasing the rate at which it successfully handles user queries.
Resource Planning
Insights from the graph can inform resource planning and allocation. Organizations can determine how many human agents are needed to handle escalations based on containment rates.
User Experience Enhancement
High containment rates contribute to a better user experience, as users can quickly and effectively resolve their issues within the chatbot interface.
Cost Efficiency
A higher containment rate is often associated with cost efficiency, as it reduces the need for human agent intervention.
Summary
In summary, a Containment Rate graph for a chatbot is a valuable tool for monitoring and improving chatbot performance in resolving user queries and issues. It helps organizations assess how effectively the chatbot contains interactions, identifies areas for improvement, and contributes to cost-effective and user-friendly support processes.