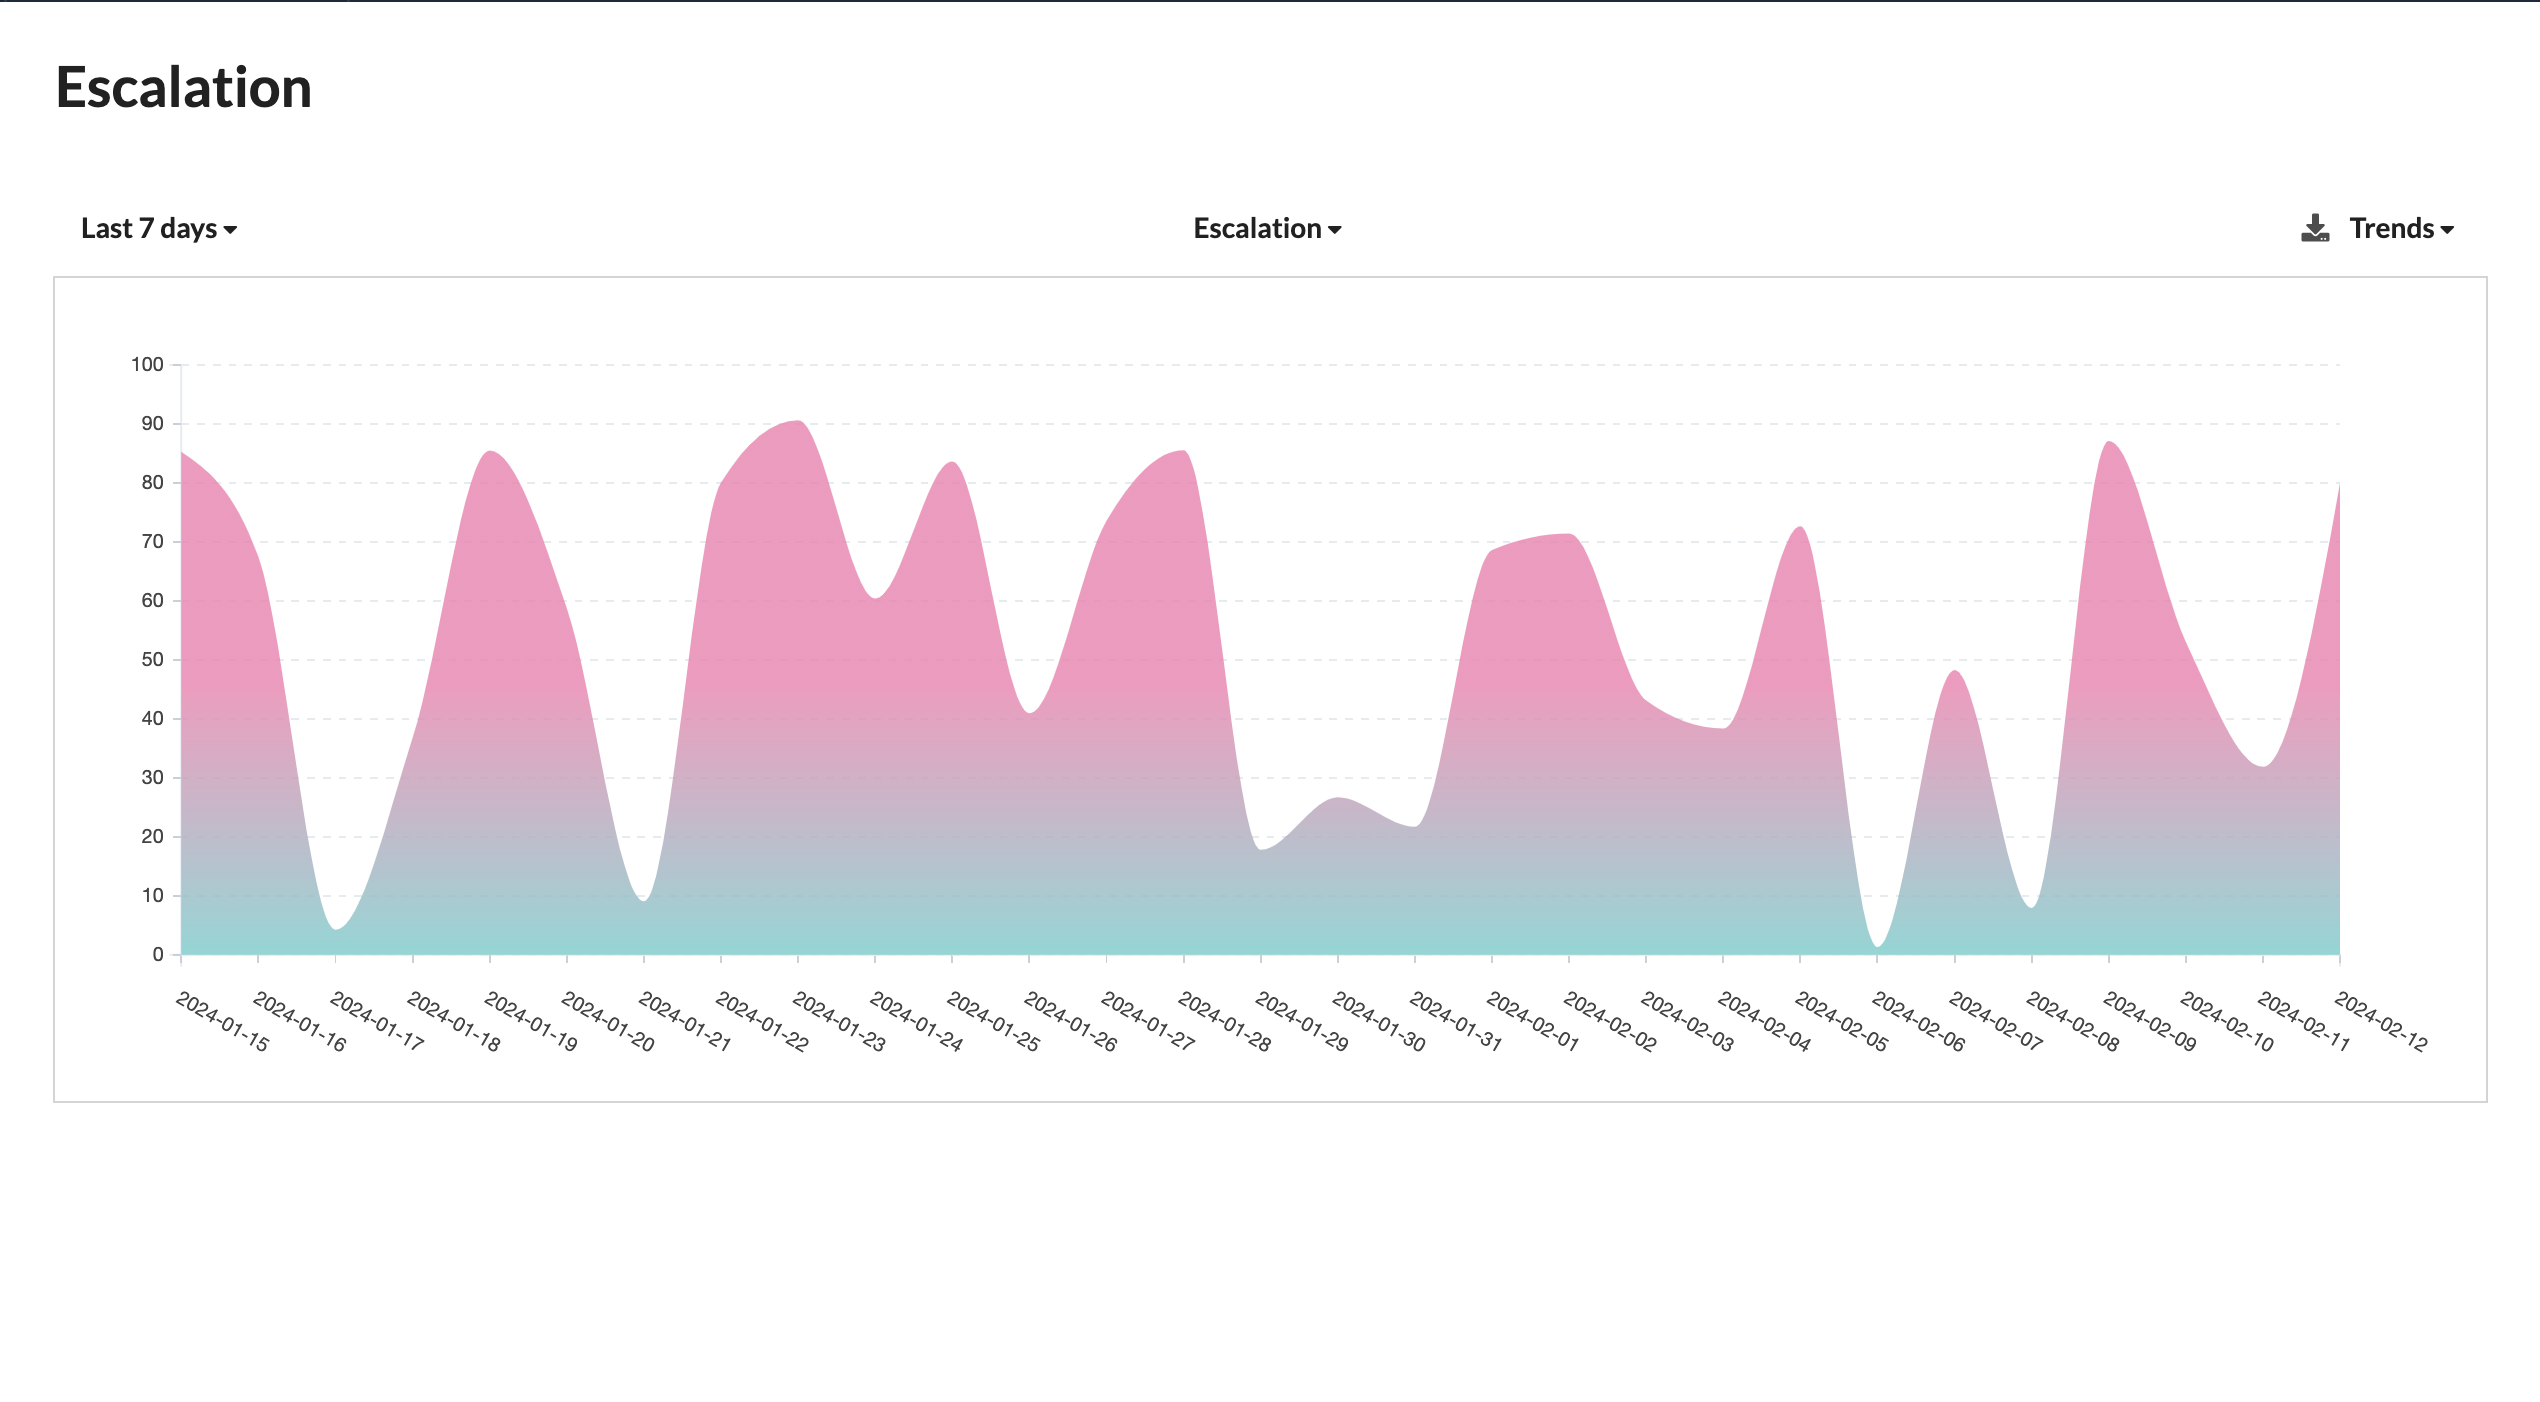
Escalation Rate Graph for Chatbots
An Escalation Rate graph for a chatbot is a visual representation that tracks and displays the frequency at which user interactions with the chatbot escalate to a higher level of support or intervention. Escalation typically occurs when a chatbot is unable to adequately address a user's request or issue, and the conversation is transferred to a human agent or a more advanced support system.
Key Elements and Significance
Escalation Rate Metric
The primary metric represented in this graph is the "escalation rate," which is the percentage of interactions or conversations that require escalation. It measures how often users engage with the chatbot but ultimately need assistance beyond what the chatbot can provide.
Time Period
The graph may cover a specific time period, such as daily, weekly, or monthly, depending on the monitoring and reporting needs of the organization.
Escalation Triggers
Escalation can occur due to various triggers, such as the chatbot's inability to understand the user's query, the user's request for human assistance, or predefined criteria that determine when escalation is necessary.
Human Agent Involvement
The graph may also indicate the extent of human agent involvement in escalated interactions. It can show the percentage of escalated conversations that are handed over to human agents for resolution.
Trends and Patterns
By analyzing the Escalation Rate graph over time, organizations can identify trends and patterns. For example, they can detect spikes in escalations during specific events or identify areas where chatbot performance needs improvement.
Optimization Insights
The graph provides insights into areas where the chatbot's performance can be optimized. High escalation rates may indicate the need for improvements in chatbot training, understanding user intent, or providing better responses.
Cost and Efficiency Analysis
Monitoring escalation rates is also important from a cost and efficiency perspective. It helps organizations assess the cost-effectiveness of using chatbots compared to human agents for specific tasks.
User Satisfaction
High escalation rates can impact user satisfaction. Monitoring these rates allows organizations to take steps to ensure a better user experience and minimize user frustration.
Use Cases for Escalation Rate Analysis
Chatbot Improvement
Organizations can use the escalation rate data to identify areas where the chatbot's performance can be enhanced, reducing the need for escalations.
Resource Allocation
Insights from the graph can inform decisions about resource allocation, including how many human agents are needed to handle escalated conversations.
User Experience Enhancement
Reducing the escalation rate contributes to a better user experience, as users can get their issues resolved more efficiently within the chatbot.
Cost Management
By optimizing the chatbot's capabilities and reducing escalations, organizations can manage operational costs more effectively.
Summary
In summary, an Escalation Rate graph for a chatbot is a valuable tool for monitoring and improving chatbot performance. It helps organizations assess the frequency of user interactions that require escalation, identify areas for improvement, and optimize the overall efficiency and cost-effectiveness of their support processes.